
Back
Reports
Overview
Detailed
Compare
Tag Breakdown
Insights
Back
Reports
The Reports section has five sub-pages, each designed for a different kind of analysis. All of them share the same global filter bar and respond to the same period, symbol, tag, and account selections.
Access Reports from the sidebar — it expands to show the five sections.
Overview
Path: Reports → Overview
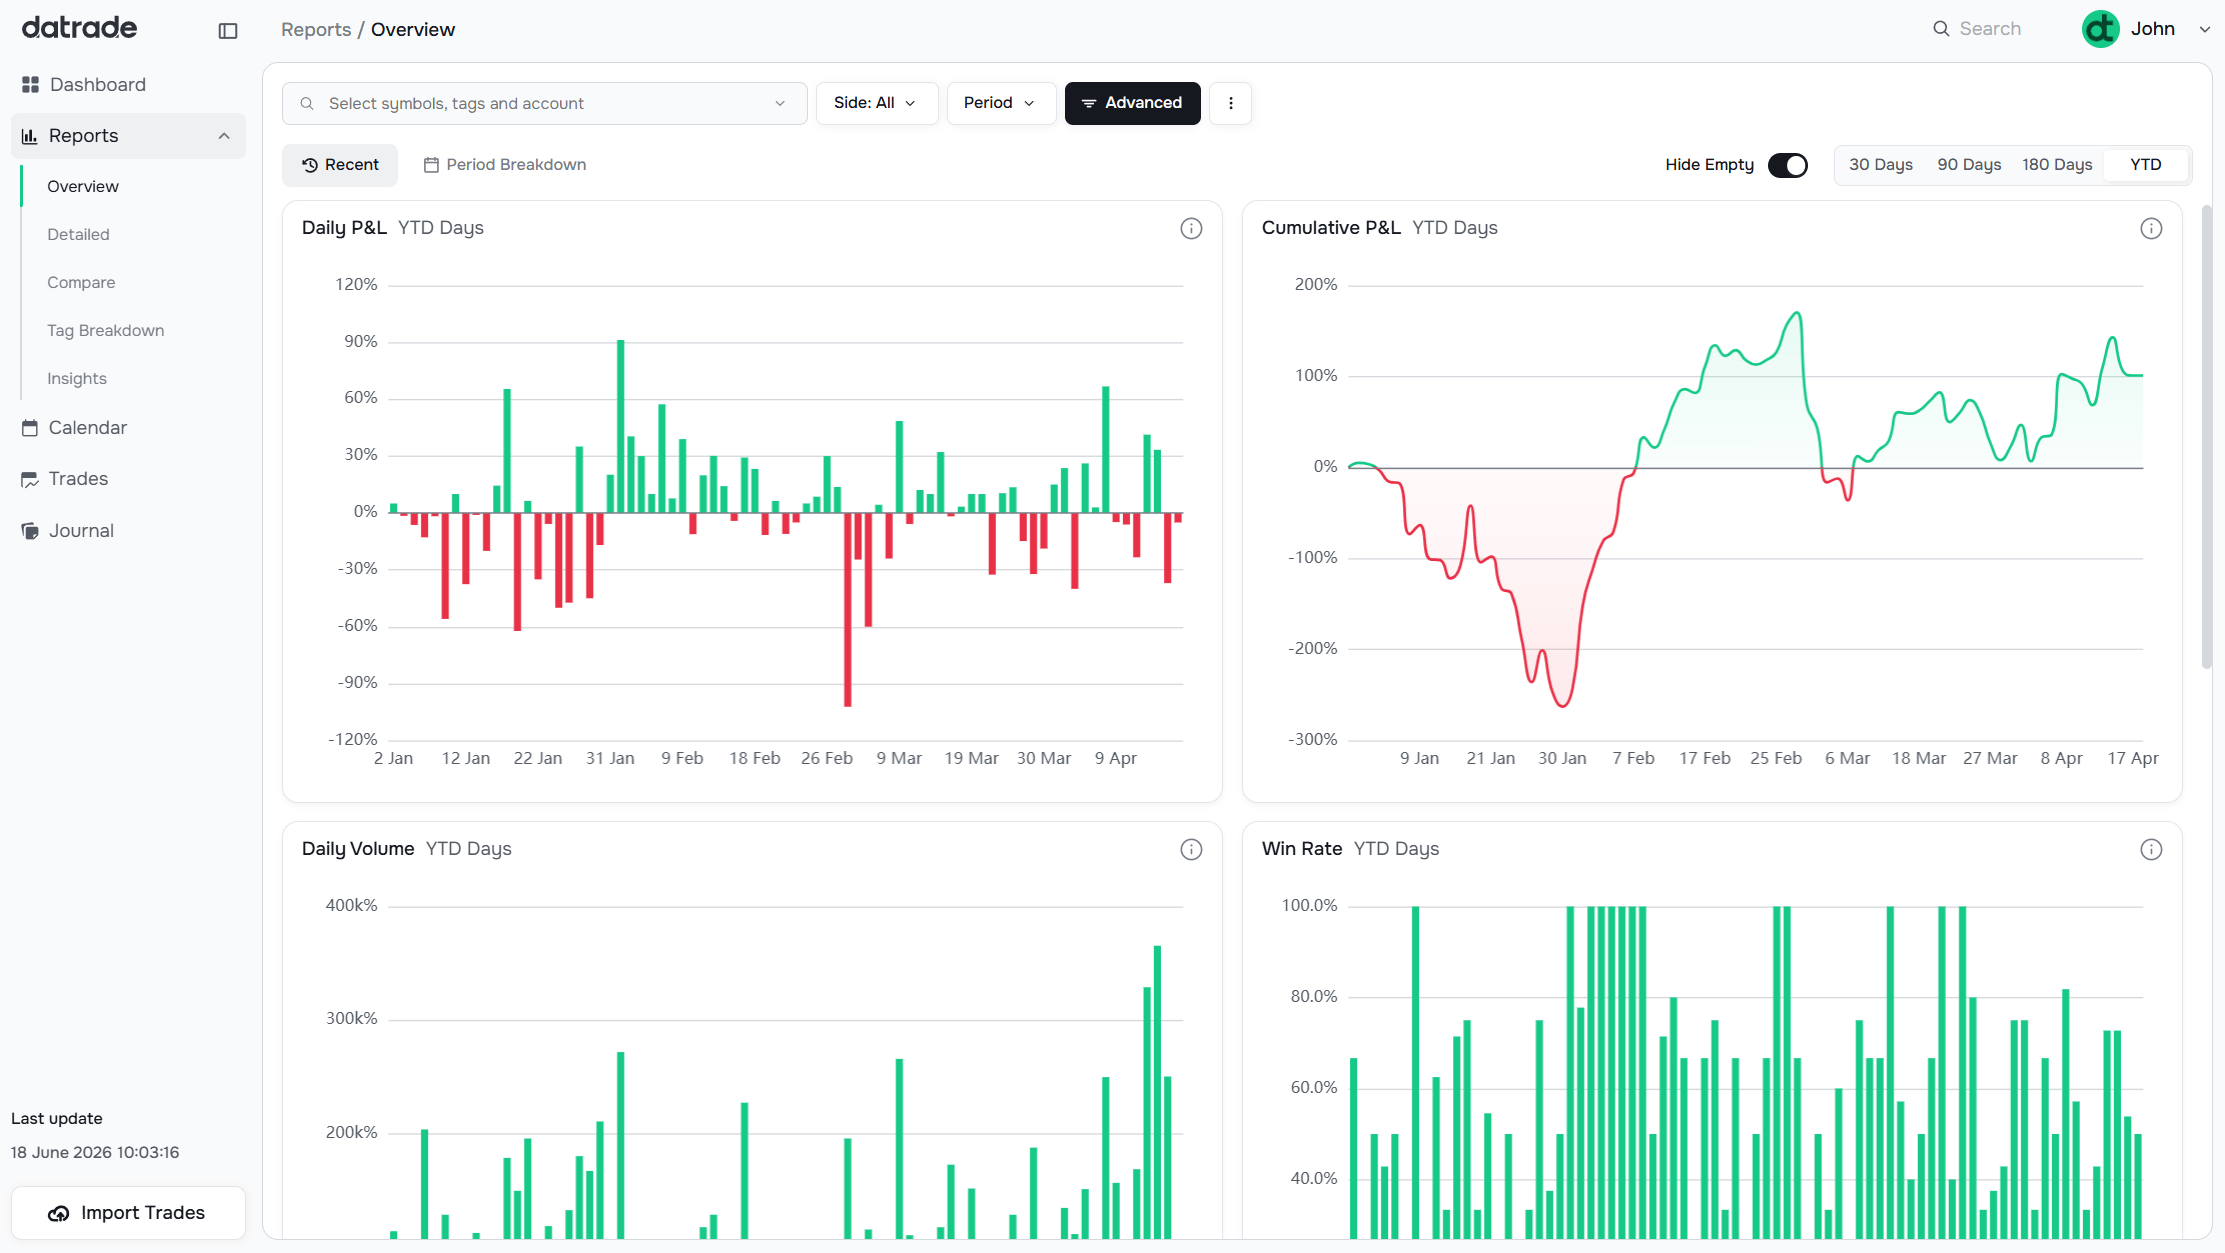
The Overview page gives a broad, time-based picture of your performance. It has two modes:
- Recent — shows charts for the last 30, 90, 180 days, or Year-to-Date, selectable from the top-right toggle
- Period Breakdown — breaks the selected period into sub-periods (weeks, months) and shows each as a column
Charts on this page:
| Chart | What it shows |
|---|---|
| Daily P&L | Bar chart of each day's realized P&L |
| Cumulative P&L | Running total of P&L over time |
| Daily Volume | Total dollar volume traded per day |
| Win Rate | Daily win percentage over the period |
| Performance Map | Win Rate vs. R:R scatter chart. Each colored dot represents a time period (30D, 90D, 180D, YTD, Total, Period). The curved line is the breakeven threshold — dots above it are profitable, dots below are not. Two dashed Tier curves (Tier 1.5 and Tier 2.5) split the profitable area into Positive, Strong and Exceptional zones. Click any legend label to hide or show that period's dot. |
| Return Distribution VaR 95% | Histogram of daily returns with the 95% VaR threshold marked |
| Tags | Summary table: P&L, Win%, Profit Factor, R:R per tag for the period |
The Hide Empty toggle removes tags from the table that have no trades in the selected period.
Detailed
Path: Reports → Detailed
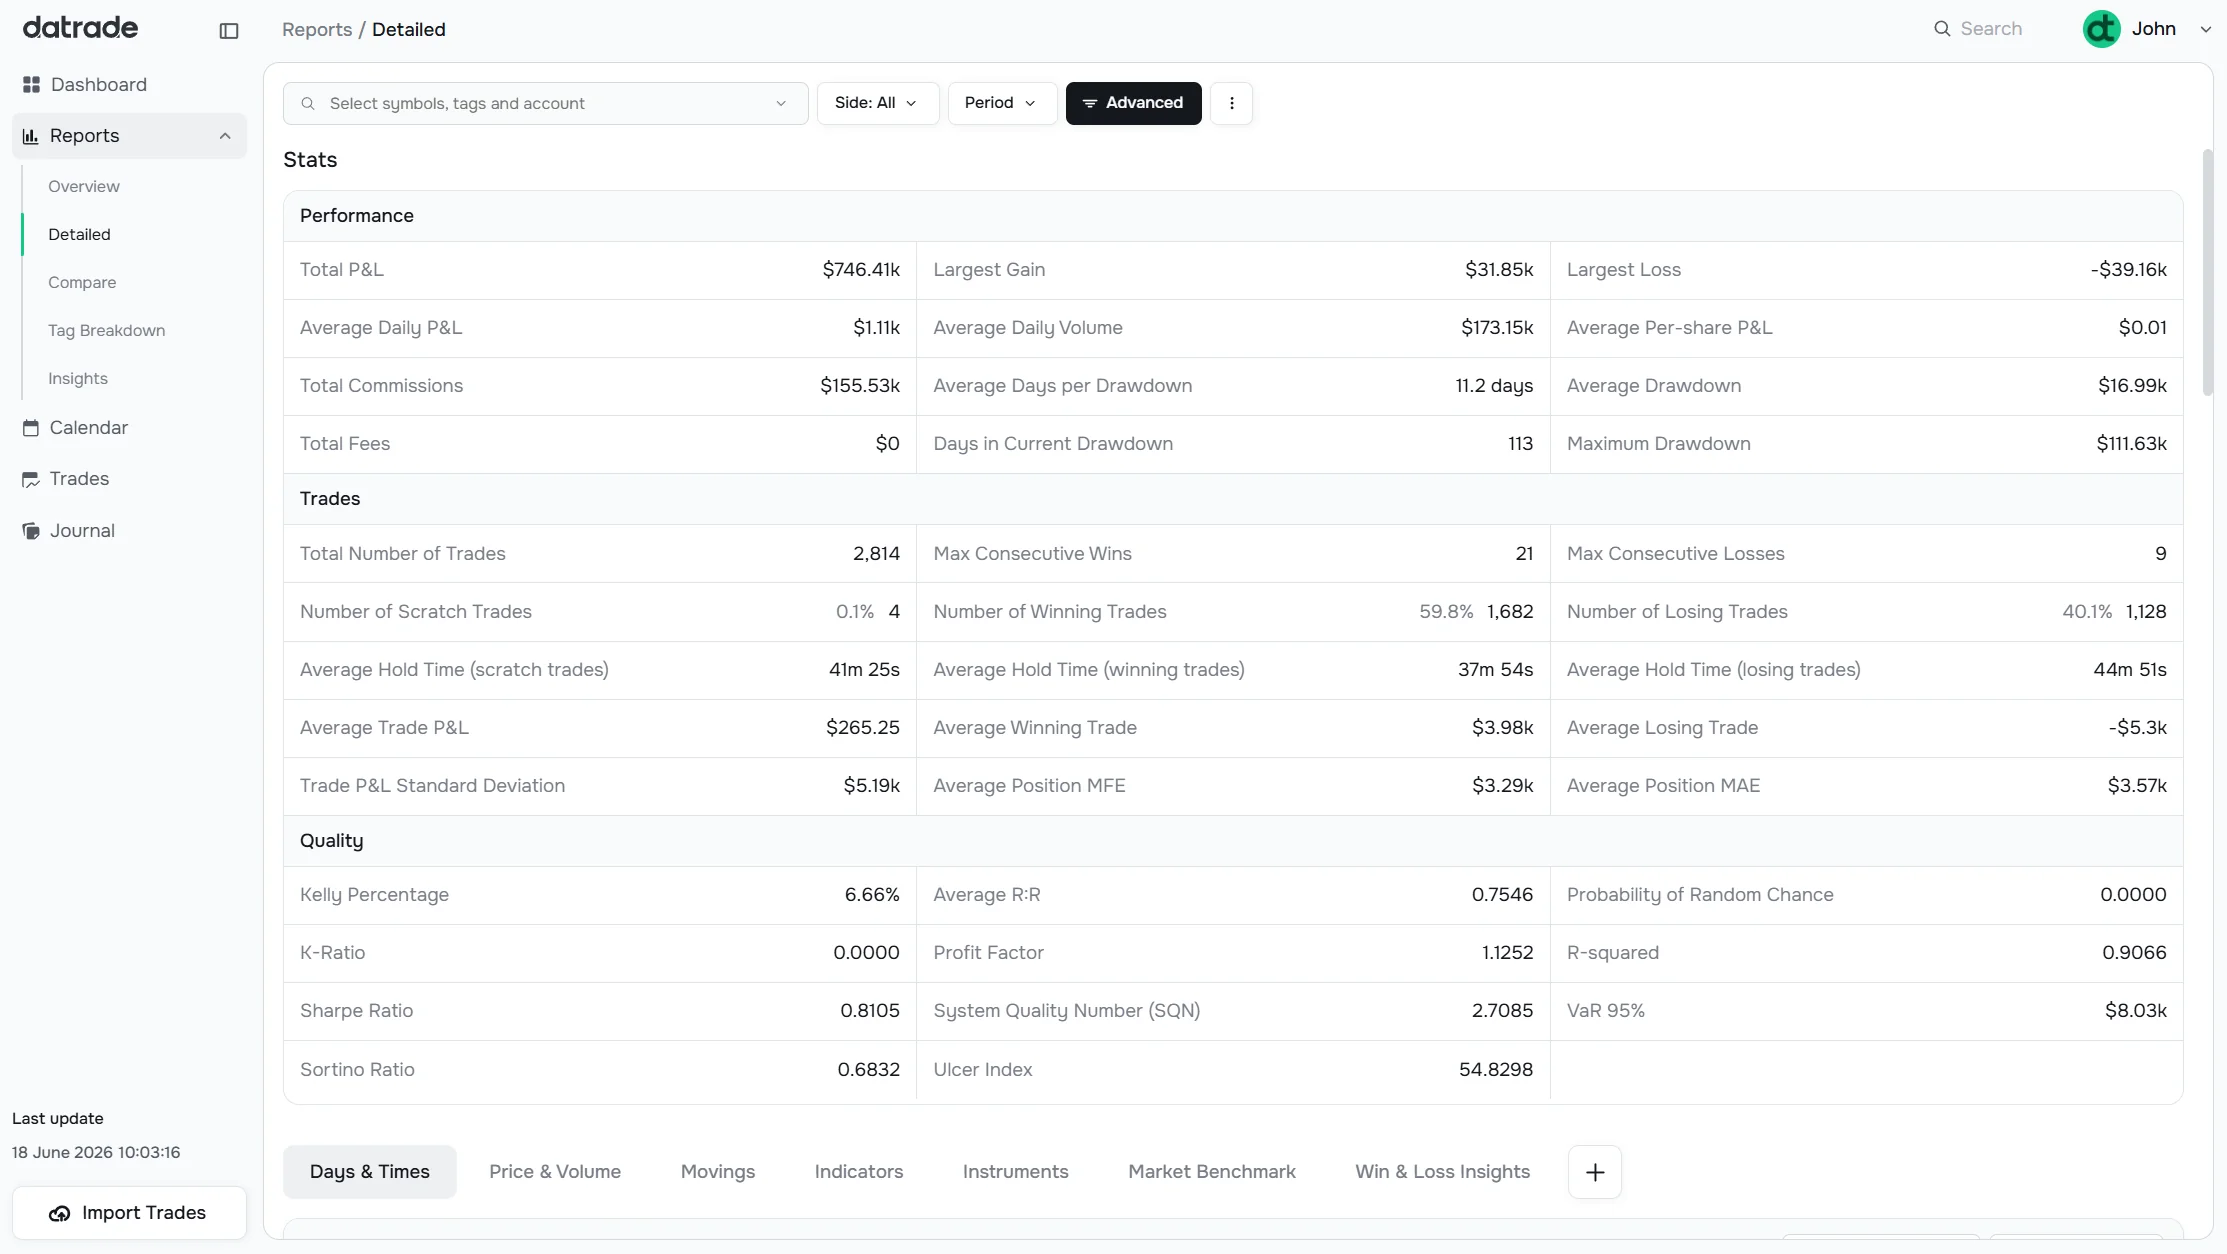
The Detailed page shows a full statistics table at the top followed by a set of chart tabs that break down your trading across multiple dimensions.
Stats table sections:
- Performance — Total P&L, Average Daily P&L, Largest Gain/Loss, Drawdown, Commissions, Fees
- Trades — Total trades, Win/Loss counts, Hold times, Average P&L, MFE/MAE
- Quality — Kelly %, Avg R:R, Profit Factor, K-Ratio, Sharpe, Sortino, SQN, VaR 95%, R-squared, Probability of Random Chance, Ulcer Index — see Metrics Glossary
Below the stats, chart tabs break down performance by dimension:
| Tab | What it shows |
|---|---|
| Days & Times | Win rate and P&L by time of day and day of week |
| Price & Volume | Performance by price range and position size |
| Movings | Moving averages (SMA/EMA) analysis |
| Indicators | RSI, MACD, ADX, and other indicator breakdowns |
| Instruments | Per-symbol breakdown |
| Market Benchmark | Your performance vs. market index |
| Win & Loss Insights | Pattern analysis on winning vs. losing trades |
Each chart tab has a Settings dropdown (timeframe, anchor, etc.) at the right.
Compare
Path: Reports → Compare
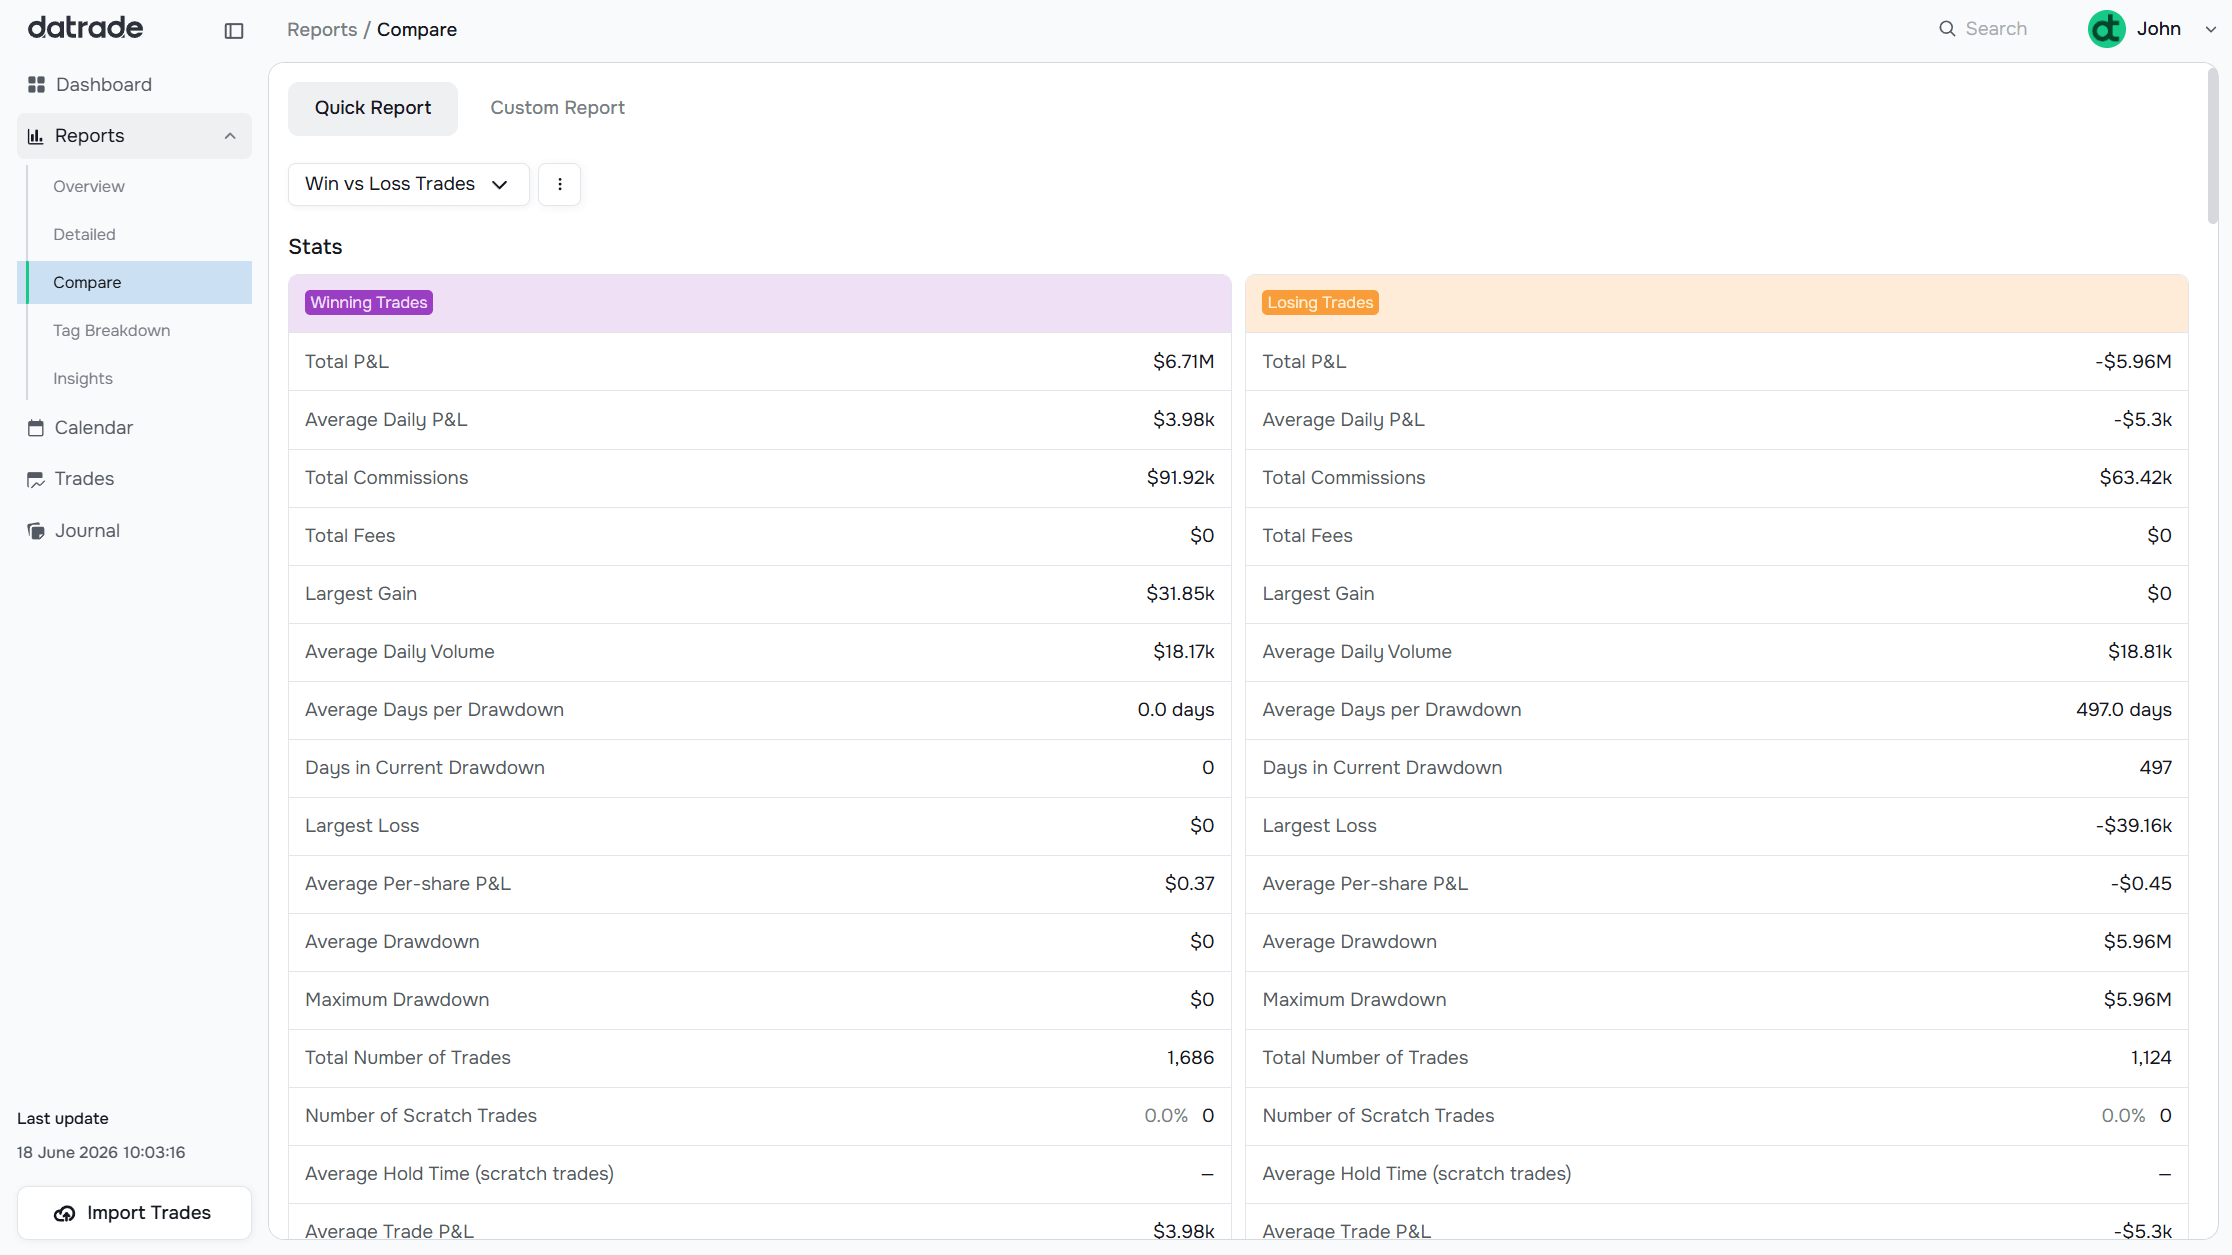
Compare puts two data slices side by side with the full stats table duplicated for each.
Two modes:
- Quick Report — select from predefined comparison pairs using the dropdown (e.g., "Win vs Loss Trades")
- Custom Report — define two arbitrary groups by applying different filter combinations to each side
Use Compare to answer questions like: "Do my morning trades outperform afternoon trades?" or "How does my Short strategy compare to my Long strategy?"
Tag Breakdown
Path: Reports → Tag Breakdown
Tag Breakdown shows how each tag in your portfolio is performing, all on one page.
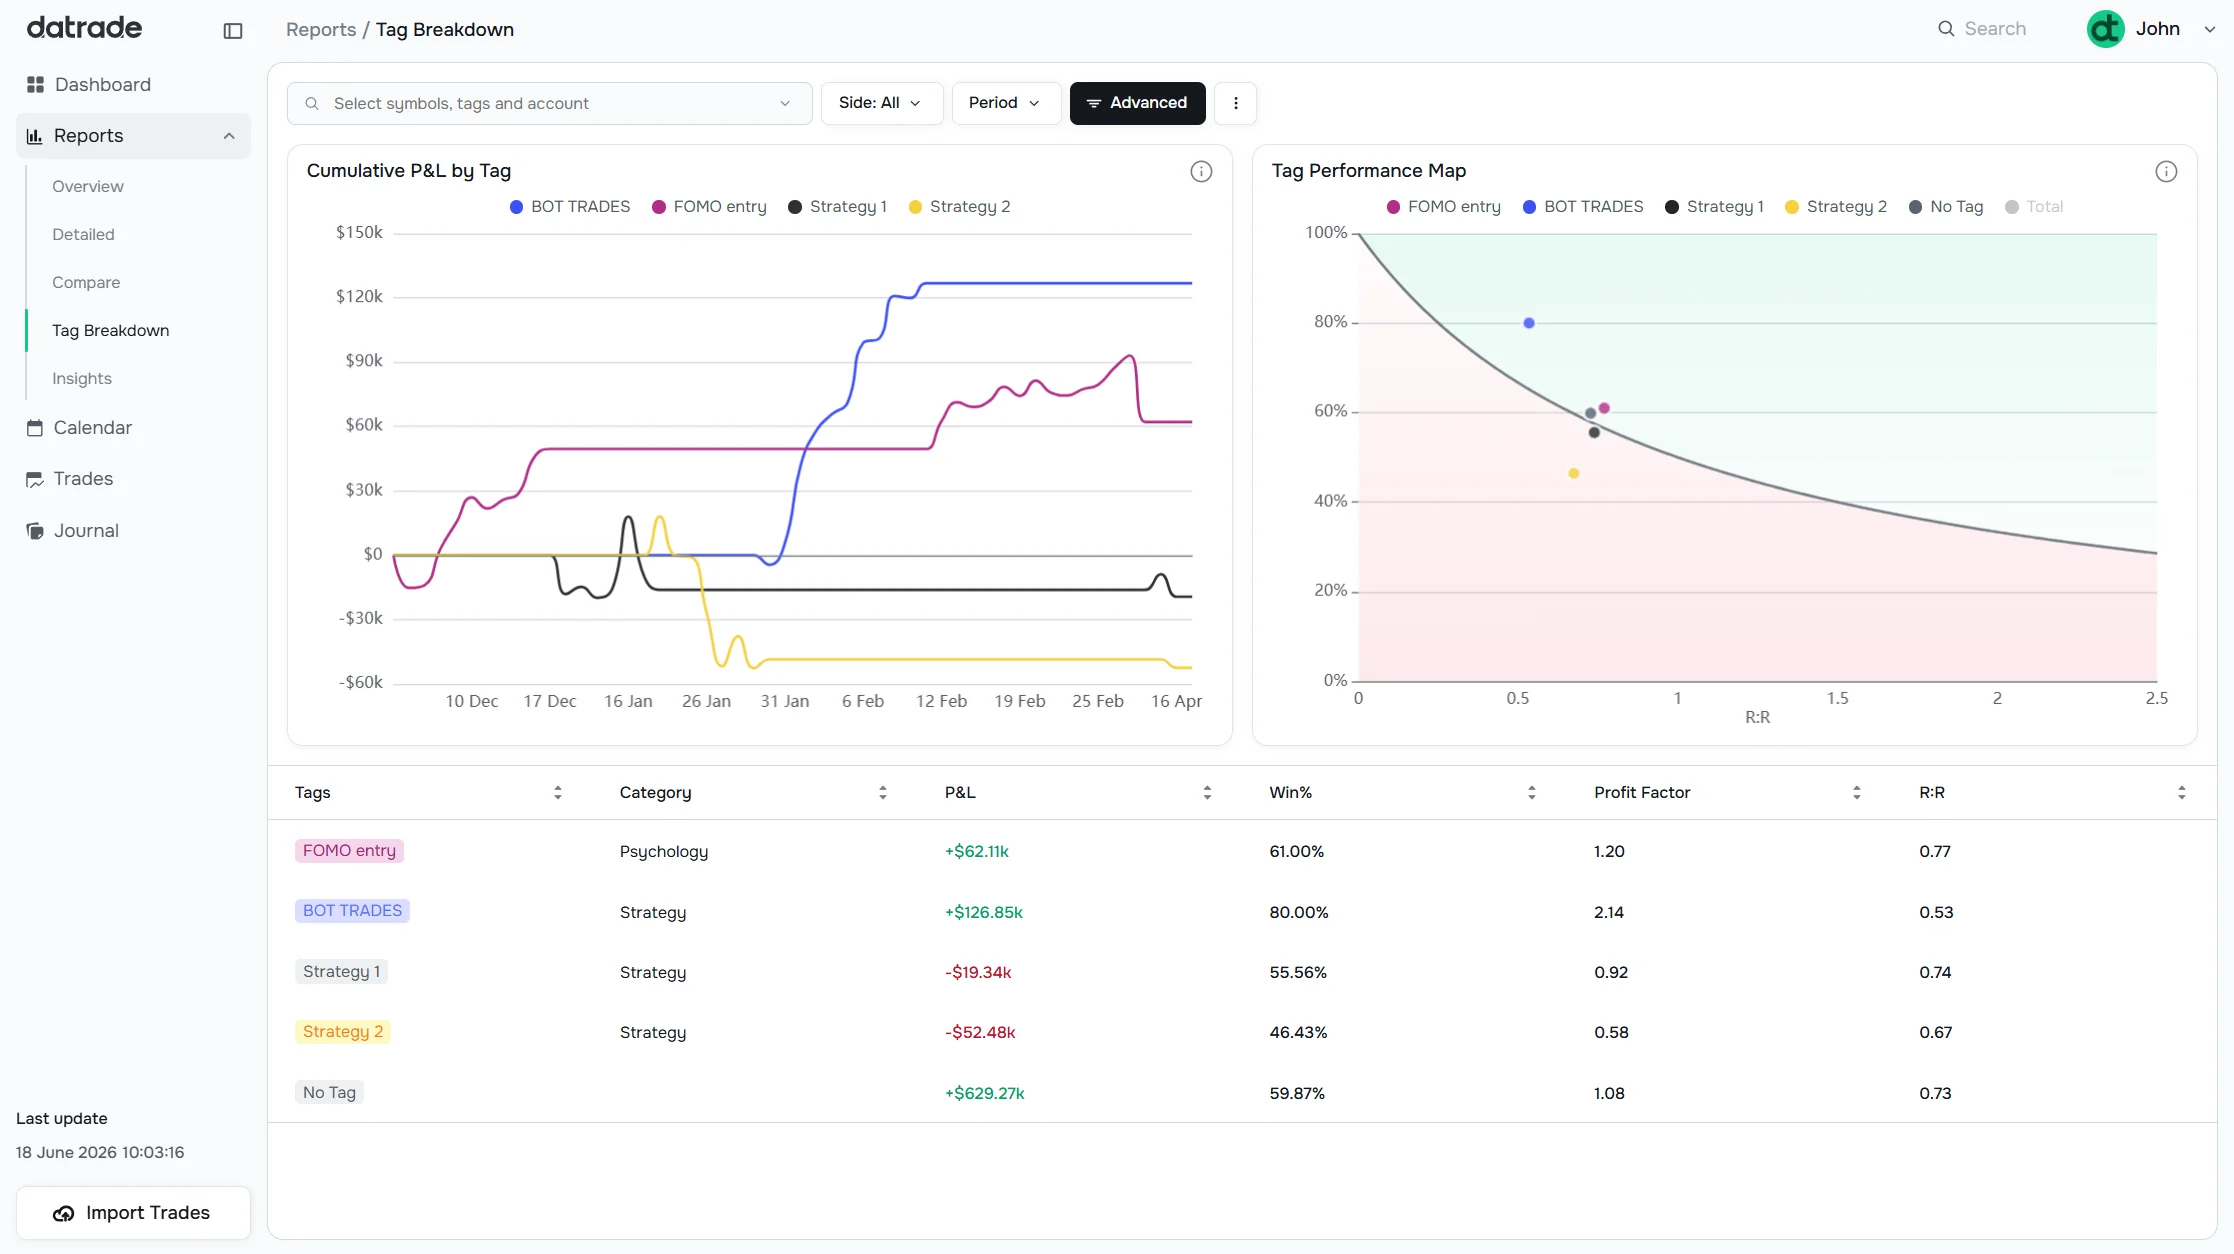
Two charts at the top:
- Cumulative P&L by Tag — a multi-line chart showing each tag's equity curve over time, color-coded per tag
- Tag Performance Map — each tag plotted as a dot on the Win% vs R:R plane, with the same breakeven curve as the Overview Performance Map. Tags above the curve are profitable; tags below it are not.
Table below: each tag with its P&L, Win%, Profit Factor, and R:R. Color-coded labels match the charts.
This page is most useful once you have enough tagged trades to see statistically meaningful patterns across strategies. Set up your tags in Tags Management.
Insights
Path: Reports → Insights
Insights contains advanced analysis tools designed for pattern-level research:
Pivots Chart — plots your P&L against a chosen indicator dimension (e.g., ADX, RSI, MACD). Trades are binned by indicator value range, letting you see how your performance correlates with specific market conditions. Configure dimension, value range, timeframe, anchor candle, and binning from the settings panel.
Scatter Plot — maps individual trades on a two-axis plane. Use Quick mode to pick a preset report type, or Custom mode to set any two dimensions as X and Y axes.
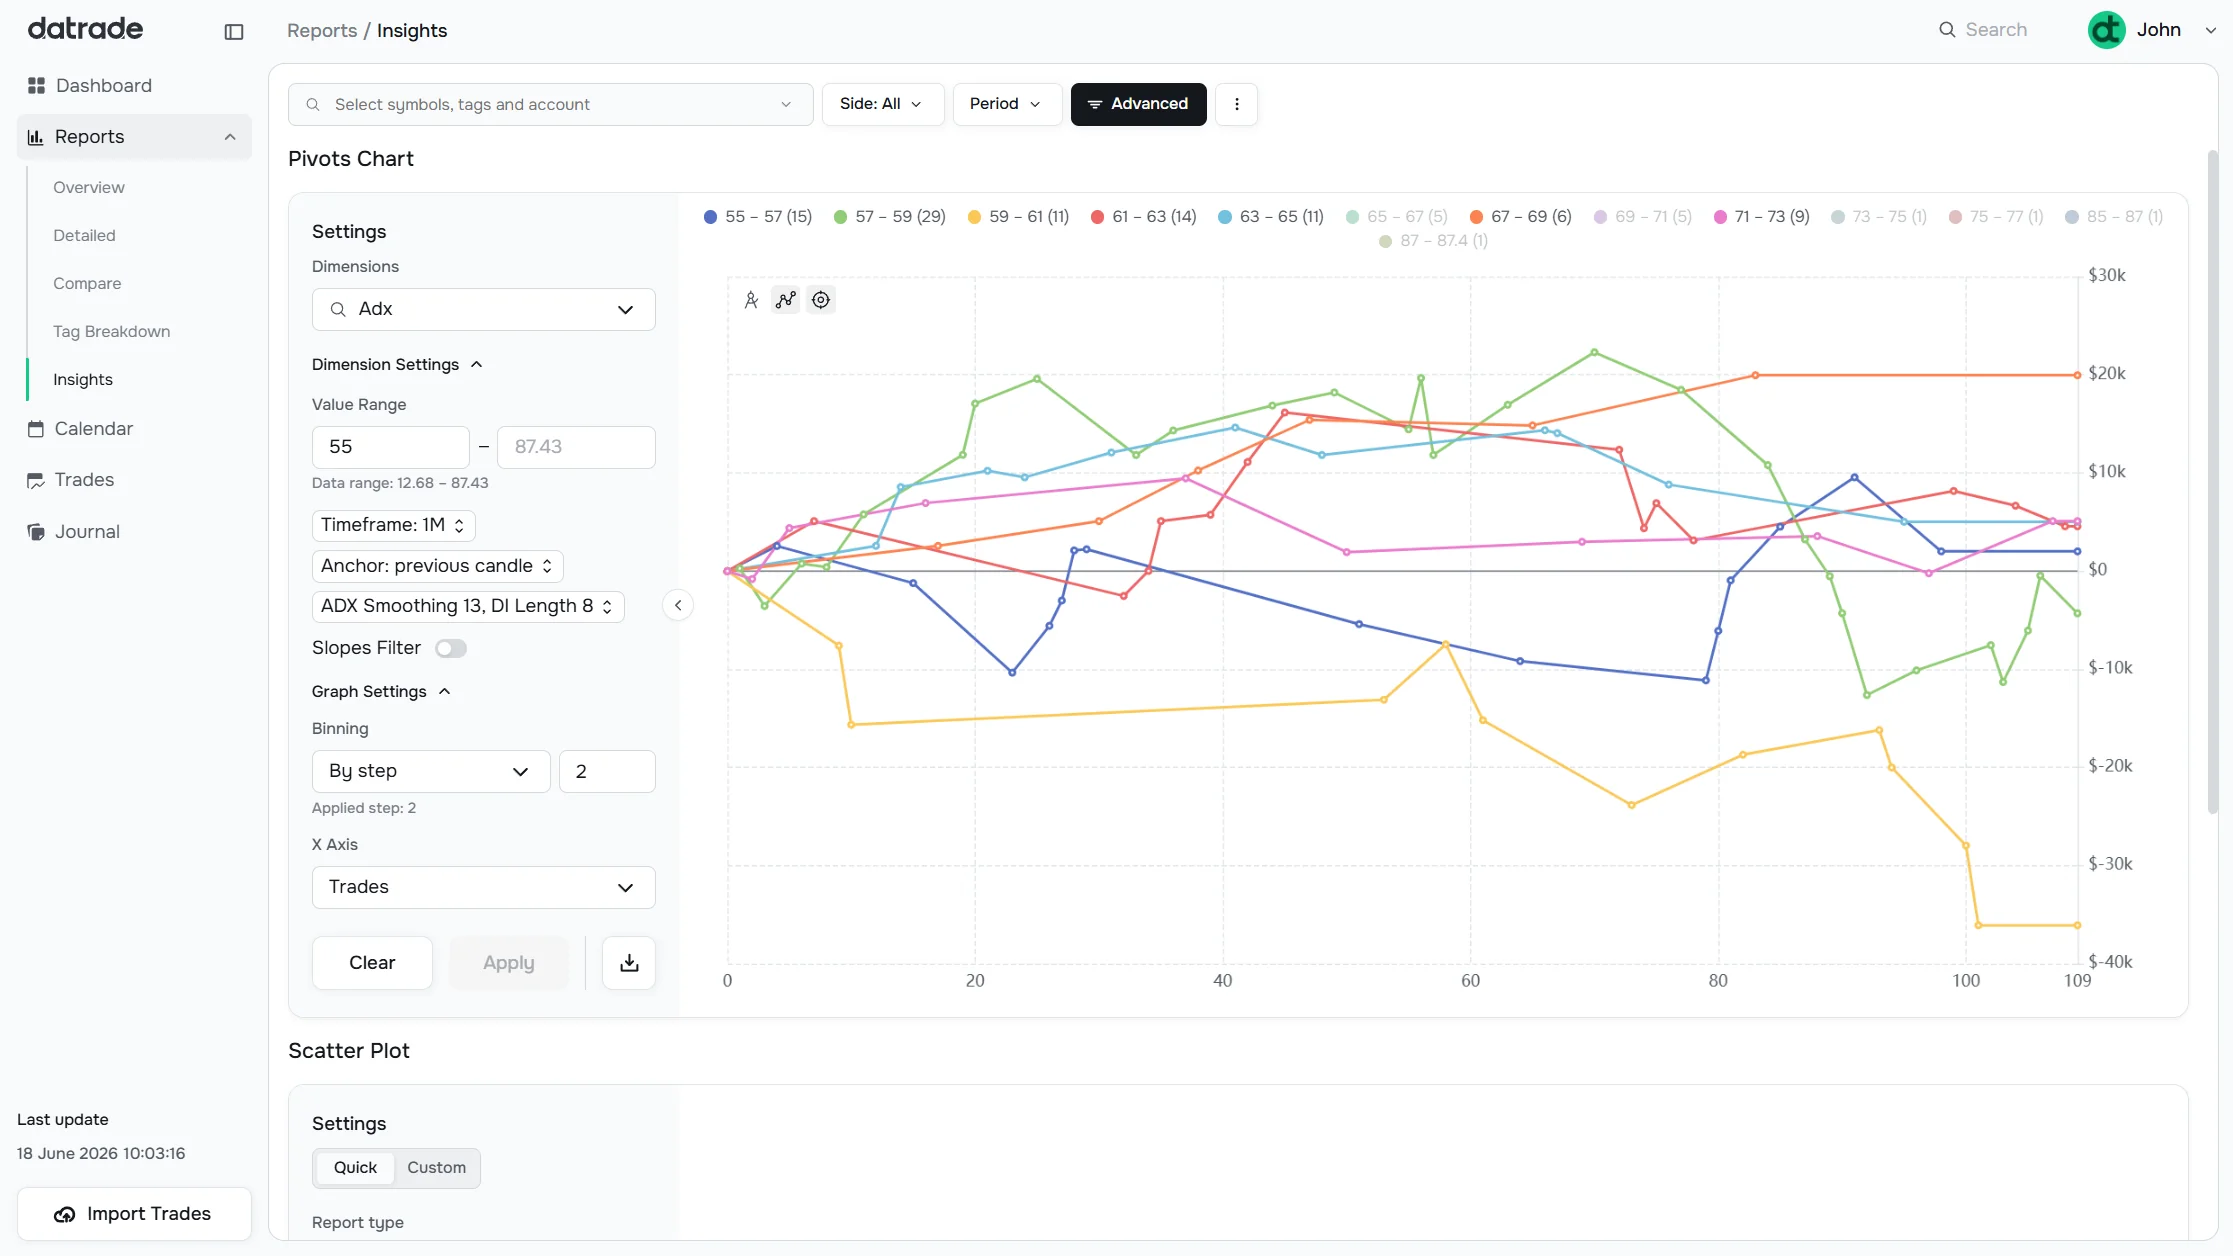
Insights is a Pro plan feature. See Subscription for plan details.
Have a question?
Let us help!
To get the best response, follow these steps when submitting your request:
Be Clear
Briefly describe the issue and any key details, like the feature used or an error message
Add Context
Explain what you were trying to do and what led to the issue
Attach a Screenshot (Optional)
A visual reference can speed up troubleshooting
We'll review your request and get back to you soon!
Get latest updates
on Datrade
Disclaimer: Datrade is not an investment advisor or signal provider. All market data and analytics are provided for informational purposes only and do not constitute financial advice or trading recommendations. Past performance is not indicative of future results, and no performance outcomes are guaranteed. Users are solely responsible for their trading decisions and actions; Datrade accepts no liability for any losses incurred from use of our data or content. Use of this site constitutes acceptance of our Terms of Service and Risk Disclosure.