
Datrade vs TradeZella
Deep market-context research vs. an all-in-one trading improvement platform.
TradeZella gives traders a broad workflow built around AI, replay, backtesting, journaling, and broker connectivity.
Datrade goes deeper on a different problem: reconstructing what was actually happening in the market when you entered — and showing under which conditions your trading performs best.
What Datrade is
Datrade is a trading journal and post-trade analytics platform. It imports historical trades, reconstructs market context around each entry, and precomputes 10,000+ market-context values per entry. Traders can analyze those values using Advanced Filters, Compare, Pivot, and Scatter. Datrade supports U.S. equities, Crypto, and Forex in this comparison-release state.
Short on time? Here’s the difference.
Choose Datrade if your main question is
Under exactly which market conditions does my trading edge exist?
Datrade builds a historical market-context database around your actual trades, then lets you filter, compare, and explore it from angles you never thought to tag when the trades happened.
Choose TradeZella if your main question is
Can I manage most of my trading-improvement workflow in one platform?
TradeZella combines journaling with AI, Trade Replay, backtesting, Playbooks, mentoring/community features, and broad broker connectivity.
Datrade is also a full trading journal.
You still get the fundamentals expected from a serious journal — the historical market-context engine sits on top of them.
Where Datrade is fundamentally different.
The difference is not another report. It is what exists in the database before the report is created.
Historical Market Context Engine
RSI, MACD, VWAP/EMA/SMA distance, RVOL, Market Cap, Shares Outstanding, SSR, halts, volatility, SPY context and more.
Your broker records the trade. Datrade reconstructs the environment in which you made it.
Point-in-Time Analysis
Current Candle is designed around the market state available through the actual trade timestamp. Previous Candle analyzes the completed signal candle instead.
10,000+ Values per Entry
Supported periods, timeframes, anchors, Regular/Extended series, instrument data, market events, volume conditions and benchmark context are precomputed for later research.
10,000+ does not mean 10,000 unrelated indicators.
Research Without Pre-Tagging
The objective database is built first. You can decide months later that you want to investigate a condition you never tagged when the trade happened.
You shouldn't need to know today every question you'll want to ask tomorrow.
Conventional journal workflow
Datrade workflow
The difference is not just how many reports exist. It is how much historical context exists before analysis begins.
Market conditions as labels vs. market conditions as data.
TradeZella has strong tagging and automation. Datrade treats objective market conditions differently: preserve the measurement first, decide how to classify it later.
“Near VWAP”
VWAP distance = 7.82%
TradeZella can automate the classification. Datrade preserves the measurement.
Questions Datrade can answer about your trading.
These are the kinds of questions the market-context database is built for.
Do my trades perform worse when RSI is above 80 at entry?
Group historical entries by RSI and compare P&L, Profit Factor, Win Rate, R:R and other metrics.
Are my shorts more profitable when the stock is already 5–10% above VWAP?
Analyze the historical numerical Distance from VWAP instead of relying on a setup tag created in advance.
Does high RSI only hurt when RVOL is low?
Combine conditions instead of evaluating one variable in isolation.
Is my edge limited to stocks below $100M Market Cap?
Filter by historical Market Cap and compare the resulting performance.
Do my results change when SSR is active or after a halt?
Use historical Rule 201 / SSR and halt context in the analysis.
Does my strategy perform worse the day after SPY closes with high RSI?
Use SPY Market RSI on a daily timeframe with Previous Candle and compare the following trades.
Does repeatedly trading the same ticker during the day hurt my results?
Daily Ticker Trade shows whether later same-ticker entries are associated with worse performance.
Is my first entry good, but my third or fourth scale-in bad?
Daily Ticker Positions analyzes how deep into a same-ticker position you were when each new entry was opened.
Am I consistently closing winning trades too early?
Best Exit compares the actual result with the maximum P&L available through the end of the full trading session.
How efficiently did I exit while the trade was actually open?
Exit Efficiency measures how much of the available move you captured during the real lifetime of the trade.
From a simple observation to deeper research.
The tools are designed to move from “this range looks interesting” to “does the relationship actually persist?”
Standard widgets
Start with one condition.
A standard widget groups your historical entries by the selected market dimension and shows Distribution, Profit Factor, Win Rate, R:R and P&L for every range.
This RSI example uses Period 14 · 5m timeframe · Current Candle, so the chart is analyzing a precisely defined historical RSI state rather than a generic tag.
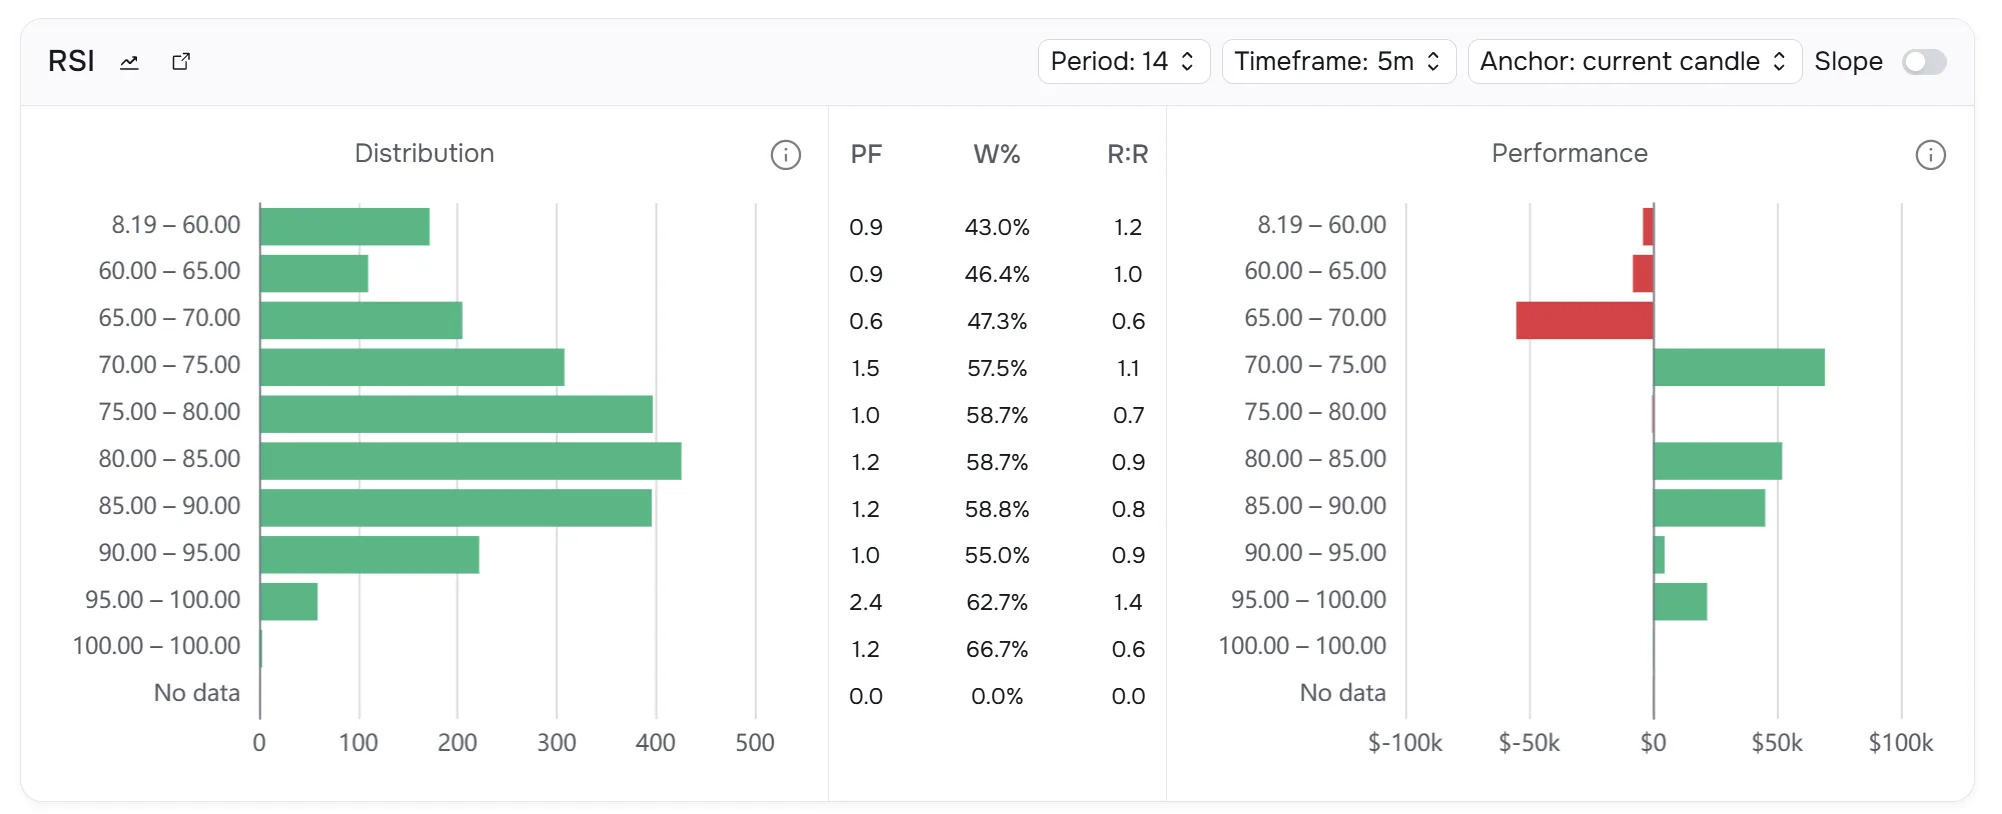
RSI is analyzed as historical structured data — with explicit period, timeframe and candle-anchor settings — then grouped into ranges with Distribution, PF, Win Rate, R:R and P&L.
Compare
Put two regimes side by side.
Compare applies the same analytical dimension and settings to two filtered groups so the difference is visible range by range — not only as one top-line P&L number.
Here, Last Year vs This Year are compared on ADX using the same smoothing, DI length, 5m timeframe and Current Candle anchor.
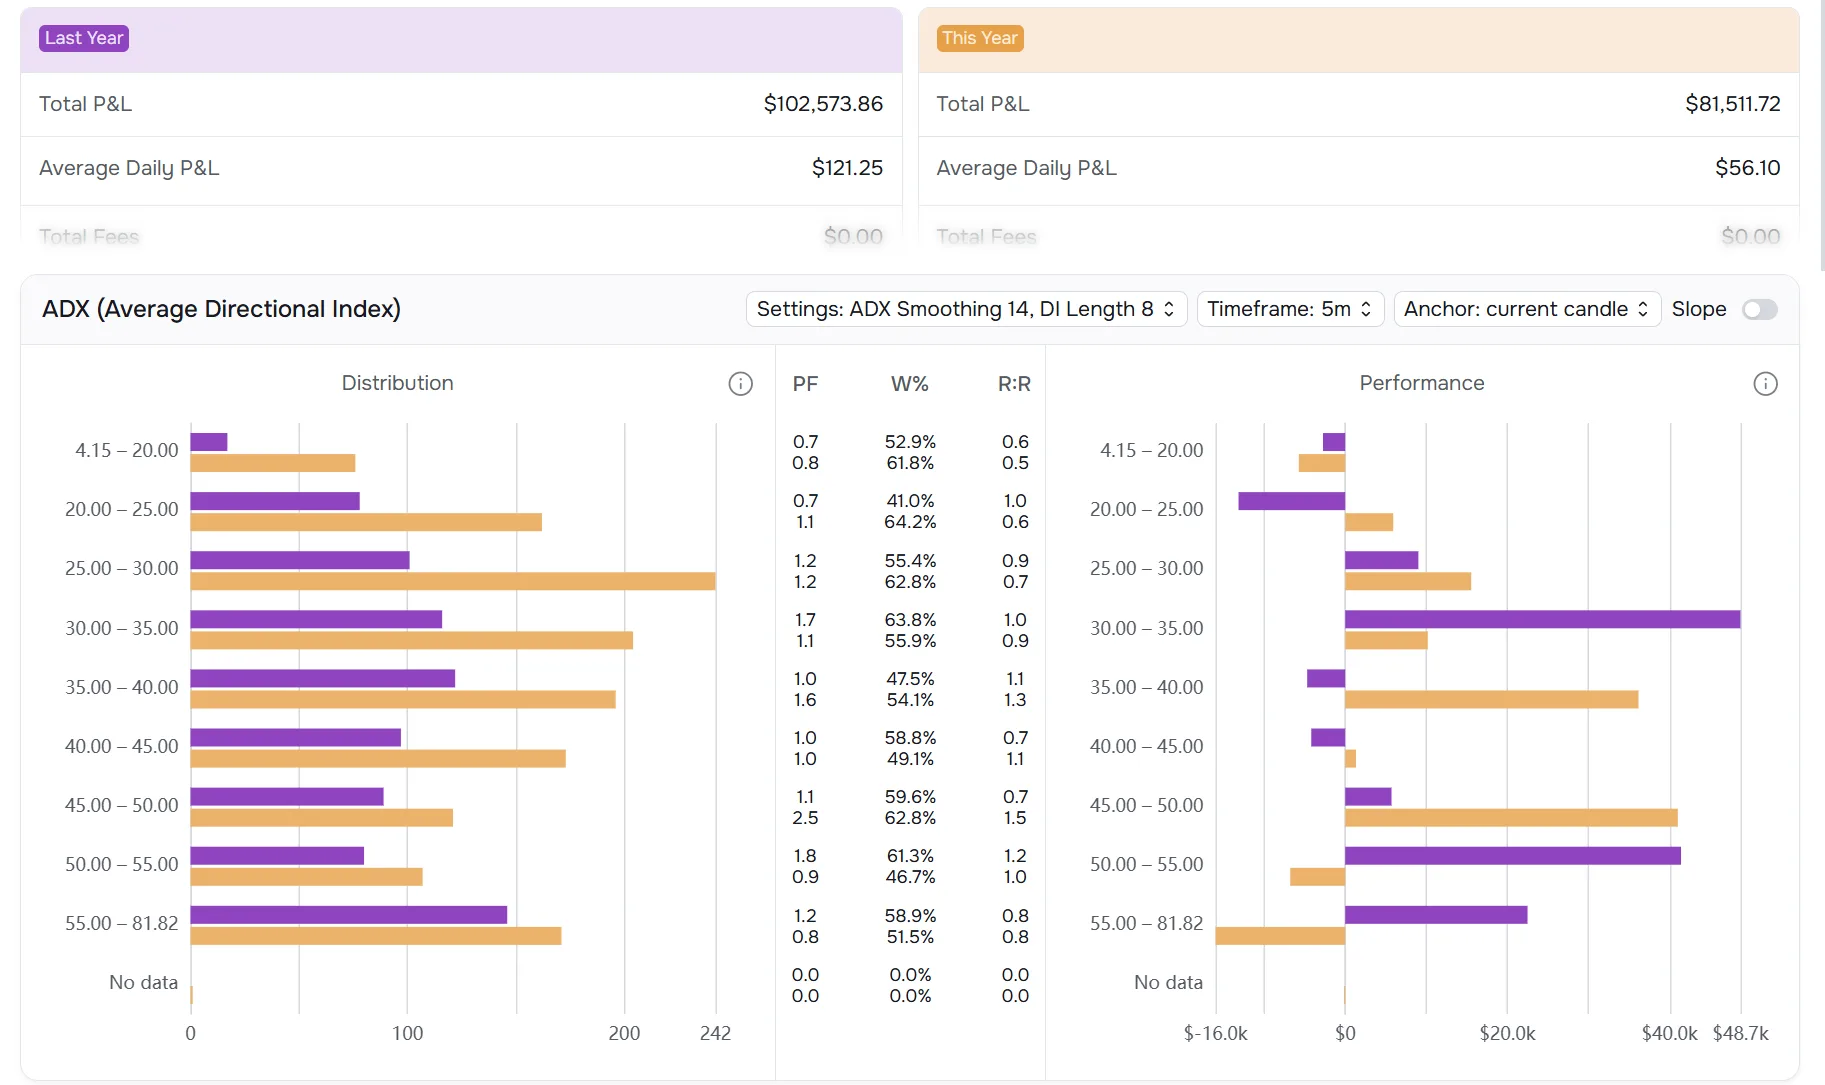
Compare applies the same analytical dimension and settings to two filtered groups — here Last Year vs This Year — so differences are visible across every ADX range.
Pivot
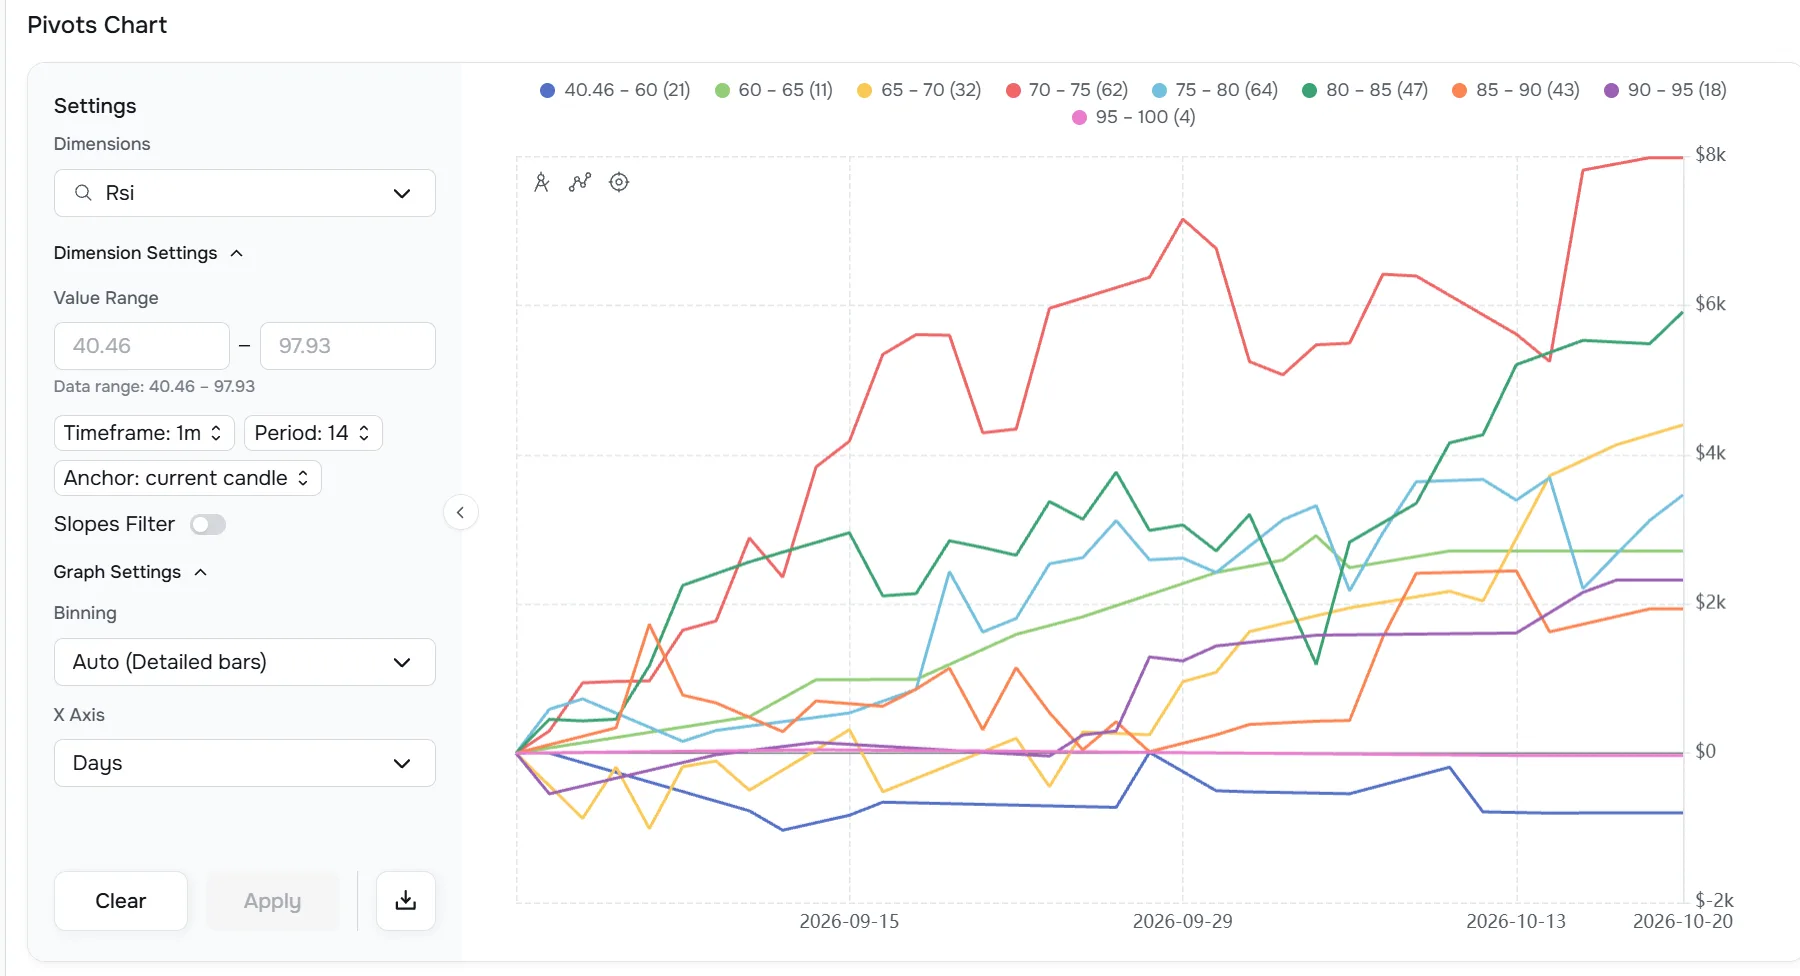
A profitable bucket is not necessarily a stable edge.
Each line shows cumulative performance for a different range of the selected dimension across Trades or Days. See whether a result persisted or came from a handful of outliers.
Scatter
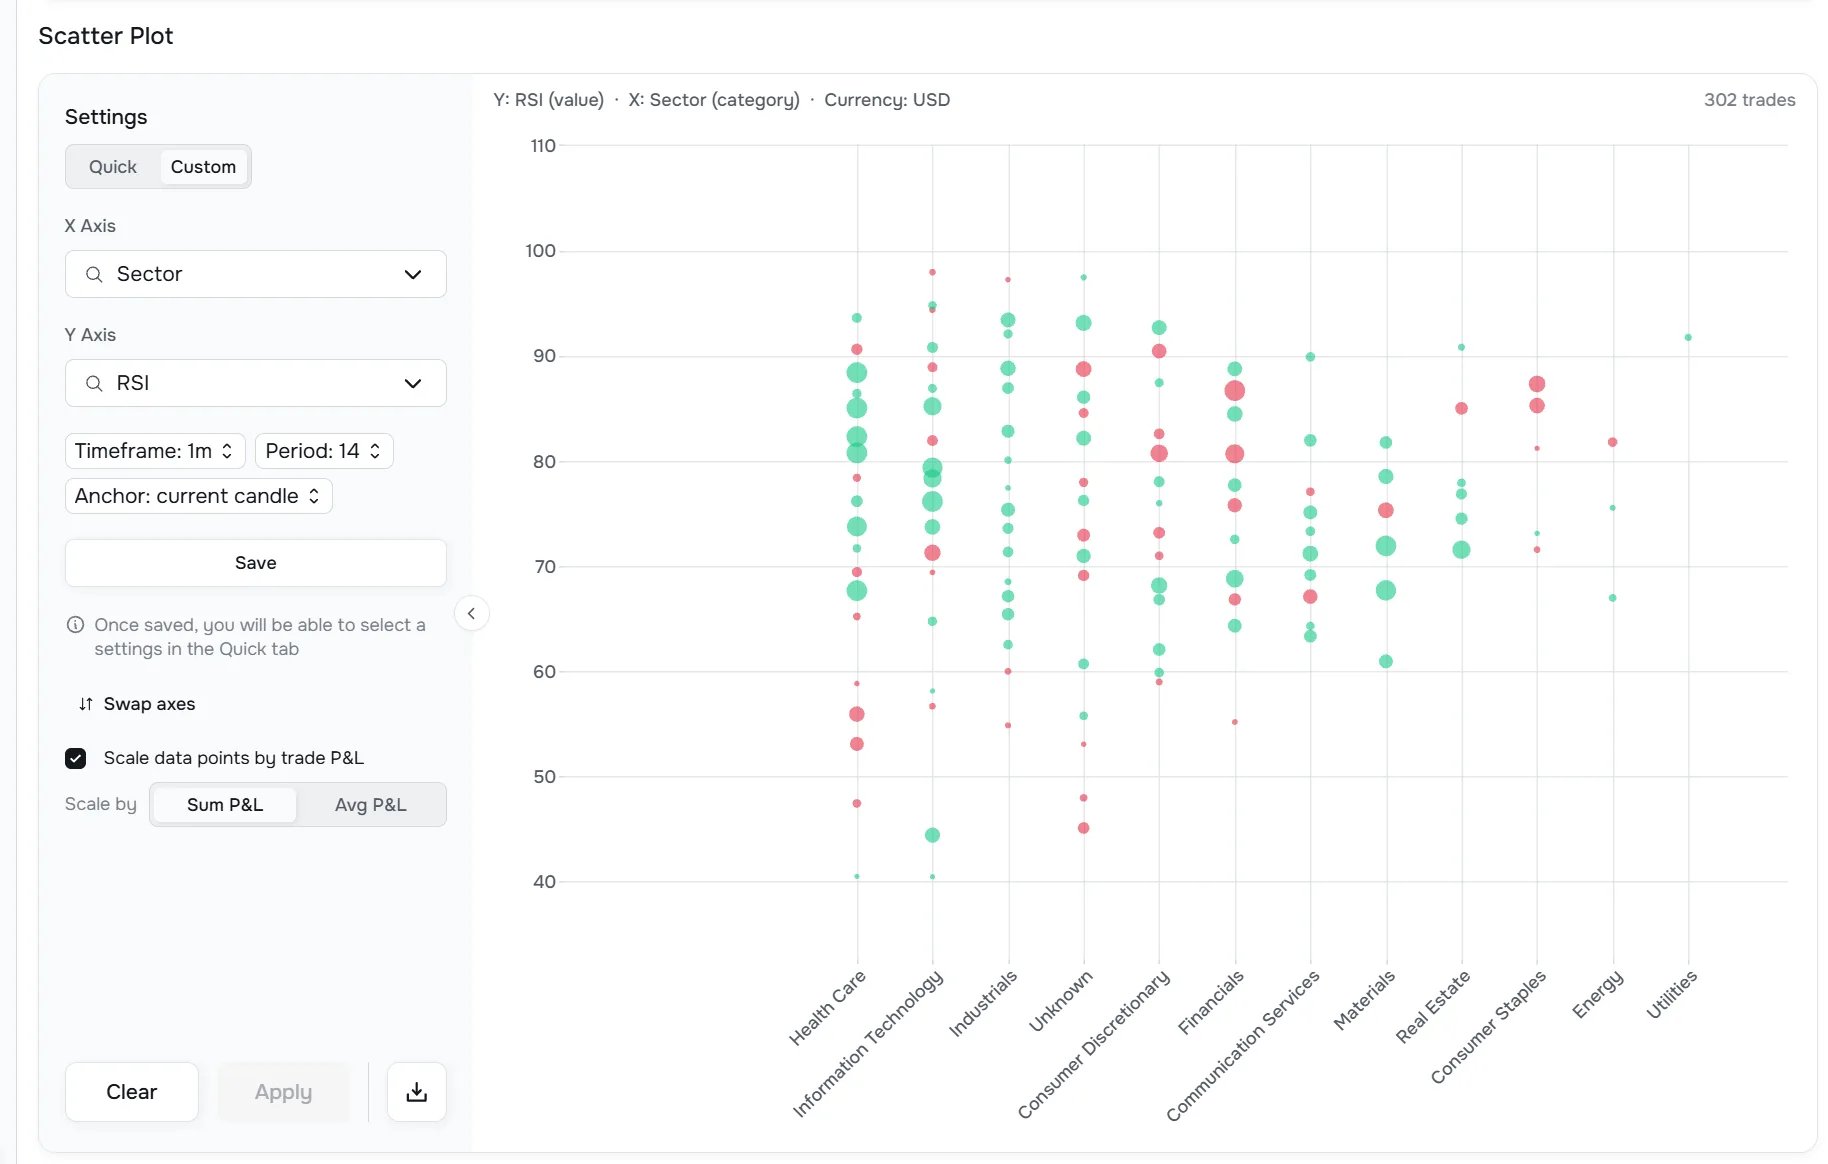
Explore how two factors interact.
Put two historical dimensions against each other. Individual trades retain exact values, while nearby points can cluster visually for readability.
Historical data should look historical.
Datrade is designed around what was true at the time of the trade — including stock characteristics and market states that can change later.
Point-in-time stock context
Shares Outstanding, Market Cap, Sector / Industry, SSR, trading halts, splits and other supported historical states.
Coverage from 2018
Historical market coverage goes back to 2018 where the required underlying data is available.
SPY benchmark
Analyze your trades against SPY conditions including RSI, MACD, opening gap, change from close and distance from moving averages.
Where each platform has the edge.
A useful comparison should make it clear when the other product is genuinely the better fit.
Datrade
Historical market context as the core data model
Objective market conditions become part of journal-wide research, not only something visible on a chart.
Point-in-time entry analysis
Research execution-time context and completed signal-candle context separately.
10,000+ precomputed values per entry
Deep context across supported settings, instrument attributes, events and benchmark conditions.
Research without pre-tagging
Ask new questions about old trades later.
Multi-factor research
Filters → Compare → Pivot → Scatter.
Strong value
$14 Basic with unlimited accounts; Pro from $44.
TradeZella
AI & automation
Zella AI, Agents, automated review/tagging and other AI-assisted workflows are live today.
Replay, backtesting & full chart workflow
Native Trade Replay, backtesting and detailed trade charts.
Broader improvement ecosystem
Playbooks, mentoring/community features, education and prop-firm workflows.
Broader connectivity & asset coverage
500+ advertised broker/prop integrations and a broader market/workflow footprint.
Datrade vs TradeZella: feature comparison.
Only decision-relevant criteria are included here. The longest checklist is not automatically the better trading journal.
| Capability | Datrade | TradeZella |
|---|---|---|
| Primary focus | Historical market-context research on actual trades | All-in-one trading improvement workflow |
| Trading journal fundamentals | Yes | Yes |
| Historical market-context database | Core product architecture | Market data, chart indicators, AI and tagging available; no comparable entry-level database found in current public documentation |
| Point-in-time indicator analysis at entry | Yes | No comparable journal-wide capability found in current public documentation |
| Current vs Previous Candle research | Yes | No comparable capability found in current public documentation |
| 10,000+ precomputed values per entry | Yes | No comparable precomputed entry-level dataset found in current public documentation |
| Historical SPY technical context | Yes | Different market-analysis workflow |
| Advanced multi-condition filtering | Yes | Yes, different data model |
| Side-by-side regime comparison | Compare | Cross Analysis / reports |
| Cumulative performance by market-condition range | Pivot | No comparable capability found in current public documentation |
| Two-variable relationship analysis | Scatter | Different analytics/reporting workflow |
| AI assistant | No | Yes |
| Trade Replay | No | Yes |
| Backtesting | No | Yes |
| Full individual trade chart | No | Yes |
| Trading accounts | Unlimited | 1 Essential / 50 Pro / Unlimited Ultra |
| Broker connectivity | Crypto Sync (Bybit, Binance) + broker file imports | 500+ advertised broker and prop-firm integrations |
| Market coverage | U.S. equities, Crypto, Forex | Broader multi-asset coverage |
| Starting monthly price | $14 | $35 |
| Refund | 7-day refund after first payment | Current Terms: non-refundable after signup |
Pricing.
Datrade keeps the same underlying market-context coverage on Basic; Pro mainly expands execution capacity and adds Pivot + Scatter.
Datrade
Basic
1,000 raw executions/year · Unlimited accounts · Full underlying market-context coverage
Explore demo data or upload your own trades before paying.
Annual billing: up to 30% off · 7-day refund window after first payment
TradeZella
Current monthly plans
TradeZella currently advertises 25% savings annually. Plan differences include account limits, AI credits, Agents, replay, automated backtesting and other features.
Category clarity
What Datrade is — and what it isn’t.
Datrade is a trading journal and post-trade research platform. It analyzes imported trading history against reconstructed historical market conditions.
Core job: Turn your actual trading history into a dataset you can investigate.
The bottom line
TradeZella is broader. Datrade goes deeper into the market context around your actual entries.
TradeZella builds more tools around the trader: AI, replay, backtesting, Playbooks, mentoring and community. Datrade builds a deeper dataset around the trade: technical conditions, volume context, historical stock characteristics, market events, SPY regime and thousands of precomputed values tied to historical entries.
What was actually happening in the market when I entered — and under which of those conditions do I perform best?
That is the problem Datrade was built to solve.
How we compare Datrade and TradeZella
This comparison focuses on capabilities that materially affect why a trader would choose one platform over the other. We intentionally do not turn every small feature into a comparison criterion.
For TradeZella capabilities, use current public pricing, product, Help Center and Terms documentation. When a comparable capability cannot be verified publicly, the wording is “No comparable capability found in current public documentation” rather than claiming the feature definitely does not exist.
Last verified: October 27, 2026.
Frequently asked questions.
Is Datrade better than TradeZella?
Not for every trader. TradeZella is stronger for AI, replay, backtesting, full charts, Playbooks, mentoring/community tools and a broader all-in-one workflow. Datrade is stronger when the primary goal is quantitative research into the historical market conditions surrounding actual entries.
Is Datrade a full trading journal or just an analytics tool?
Datrade is a trading journal as well as an analytics platform. It supports imports, manual trade entry, Notes, Custom Tags, Calendar, multiple accounts, commissions, R-multiple, MFE/MAE, risk and performance statistics, position-size analysis and other journal functionality.
Does TradeZella analyze market conditions?
Yes. TradeZella has market data, chart indicators, Zella AI, Auto-Tagging, Cross Analysis, Playbooks, reports and other analytical tools. Datrade’s difference is that a broad set of historical market conditions becomes structured context around individual entries and can be analyzed across the full trading history.
Can Datrade analyze RSI as it looked when I entered?
Yes. Current Candle is designed around the market state available through the actual trade timestamp rather than simply assigning a later completed candle back to the earlier trade.
Can Datrade analyze yesterday’s SPY RSI against today’s trades?
Yes. Use SPY Market RSI on a daily timeframe with Previous Candle to research how later trades performed depending on the state of SPY at the previous daily close.
Can Datrade analyze historical trades by VWAP distance?
Yes. Distance from VWAP is a numerical historical market-context dimension, so the trader does not have to have manually created a “Near VWAP” tag when the trade occurred.
How far back does Datrade historical market data go?
Datrade’s historical dataset goes back to 2018 where the required underlying data is available.
Does Datrade have AI, Trade Replay or backtesting?
Not currently. If those capabilities are central to your workflow, TradeZella has the stronger current offering. Datrade focuses on historical market-context research around imported trades.
Can I try Datrade with my own trades before paying?
Yes. The planned launch-state 7-day free trial includes preloaded demo trades and lets you upload your own trading history. This prototype assumes that new trial flow is live.