
Datrade vs Tradervue
Which trading journal helps you understand what drives your results?
Tradervue focuses on reviewing and reporting your trades. Datrade goes further by reconstructing the market conditions around each entry.
Both are full trading journals. The difference is the data you can investigate after your trades are imported.
What Datrade is
Datrade is a full trading journal built for quantitative post-trade research. It includes imports, Crypto Sync, manual entries, Notes, Tags, Calendar, unlimited accounts, performance and risk statistics, MFE/MAE, and exit analytics. Its differentiating layer reconstructs historical market context around each entry, precomputes 10,000+ market-context values per entry, and makes that data available through Filters, Compare, Pivot, and Scatter.
10,000+ means supported combinations of indicators, timeframes, periods, candle anchors, session settings, stock/event data and benchmark context — not 10,000 different indicators.
How Datrade actually works.
Import or sync your trading history. Datrade calculates the supported historical market context automatically — no pre-tagging required.
1. Import your trades
Bring in broker executions through manual import or Crypto Sync.
2. Datrade calculates each entry
Each entry gets its own supported historical context — RSI, MACD, VWAP distance, RVOL, Market Cap, SSR, halts, SPY context and more.
3. Later entries keep their own context
A scale-in can have different RSI, VWAP distance, RVOL and other values than the first entry into the position.
4. Analyze it whenever you want
Come back later and filter, compare or visualize results by conditions you never tagged when the trade happened.
Tradervue analyzes the trade. Datrade analyzes the trade and the market around it.
Both are full trading journals with reports, filters, comparisons, charts, tags, and performance analytics. The difference is how much context sits behind each historical entry.
Tradervue
Analyze the trade itself.
Review your executions, performance, charts, tags, market and instrument reports, and other journal data to understand how you traded and how the trade turned out.
Datrade
Analyze the trade — plus the market conditions behind it.
Datrade gives you the same core journal analysis, then adds point-in-time technical, volume, stock, event, and SPY context around each entry so you can see which conditions are associated with better or worse results.
The difference is not the report format. It is the depth of historical data available behind the report.
A concrete example
“How much volume did this stock trade today?” is not the same as “What was RVOL when I entered at 10:17?”
Tradervue's Instrument reports are useful for classifying the completed trading day. Its documentation explicitly says those calculations rely on closing data, including full-day volume and other end-of-day fields.
That is useful after the fact — but it is a different question.
Datrade is designed to reconstruct the market state around the entry itself. For an intraday trader, that means you can research the conditions that actually existed when the decision was made rather than only how the day eventually finished.
The same distinction applies to SPY. Tradervue has useful market-day reports and multiple market proxies. Datrade currently uses SPY as its benchmark and can analyze supported SPY technical context associated with the trade — for example RSI, MACD or distance from EMA.
Charts show you a trade. Structured data lets you research thousands of trades.
Tradervue's integrated TradingView charts are a real strength. You can inspect entries and exits visually, add studies, and change timeframes. Datrade solves a different job.
Tradervue chart workflow
Open the trade and inspect RSI on its chart.
Great for visual review of that execution.
Datrade research workflow
Ask how every trade with RSI 80–90 performed.
Datrade calculates the RSI value for each historical entry, so you can later group all of those trades by RSI and see how each range performed.
The Datrade advantage is not “we have RSI too.” It is that supported RSI-at-entry becomes researchable data across your trading history.
Example: if you enter at 10:17:26 and analyze a 15-minute timeframe, Current Candle looks at the market state through the entry time, while Previous Candle uses the last completed 15-minute candle before that entry.
Historical coverage from 2018
Historical market coverage goes back to 2018 where the required underlying data is available.
Regular vs Extended hours
For U.S. equities, supported indicator research can use Regular-hours or Extended-hours market data where that setting is available.
Historical stock context
Datrade is designed around what was true at the time — including split-aware prices, historical Shares Outstanding, Market Cap, SSR, halts and other supported stock/event data.
What can that actually help you discover?
These are the kinds of questions Datrade is built to answer without requiring you to have tagged the market condition when the trade happened.
Are my shorts worse when RSI is already above 80?
Group historical entries by RSI range and compare P&L, Profit Factor, Win Rate, R:R, and other performance metrics.
Do I actually have an edge when a stock is 5–10% above VWAP?
Use the historical numerical distance from VWAP rather than a subjective “extended” tag.
Does high RSI only hurt me when RVOL is low?
Combine conditions instead of analyzing one factor at a time.
Does my strategy break when SPY is weak?
Research your trades against supported SPY technical and market context.
Was the setup already weak before I clicked?
Use Previous Candle to analyze the last completed signal candle rather than the execution-time state.
Do my third and fourth scale-ins make the trade worse?
Datrade tracks the context of each new entry into the same symbol, so later scale-ins can be compared with earlier entries instead of inheriting the first entry's market conditions.
The job is not just to find a pattern. It is to use that evidence to refine what you trade, when you trade it, and which conditions or setups you avoid.
From “interesting pattern” to actual research.
Important: Datrade helps surface historical relationships and patterns. It does not by itself prove that one market condition caused the result.
Structured indicator data
Turn RSI into a journal-wide variable.
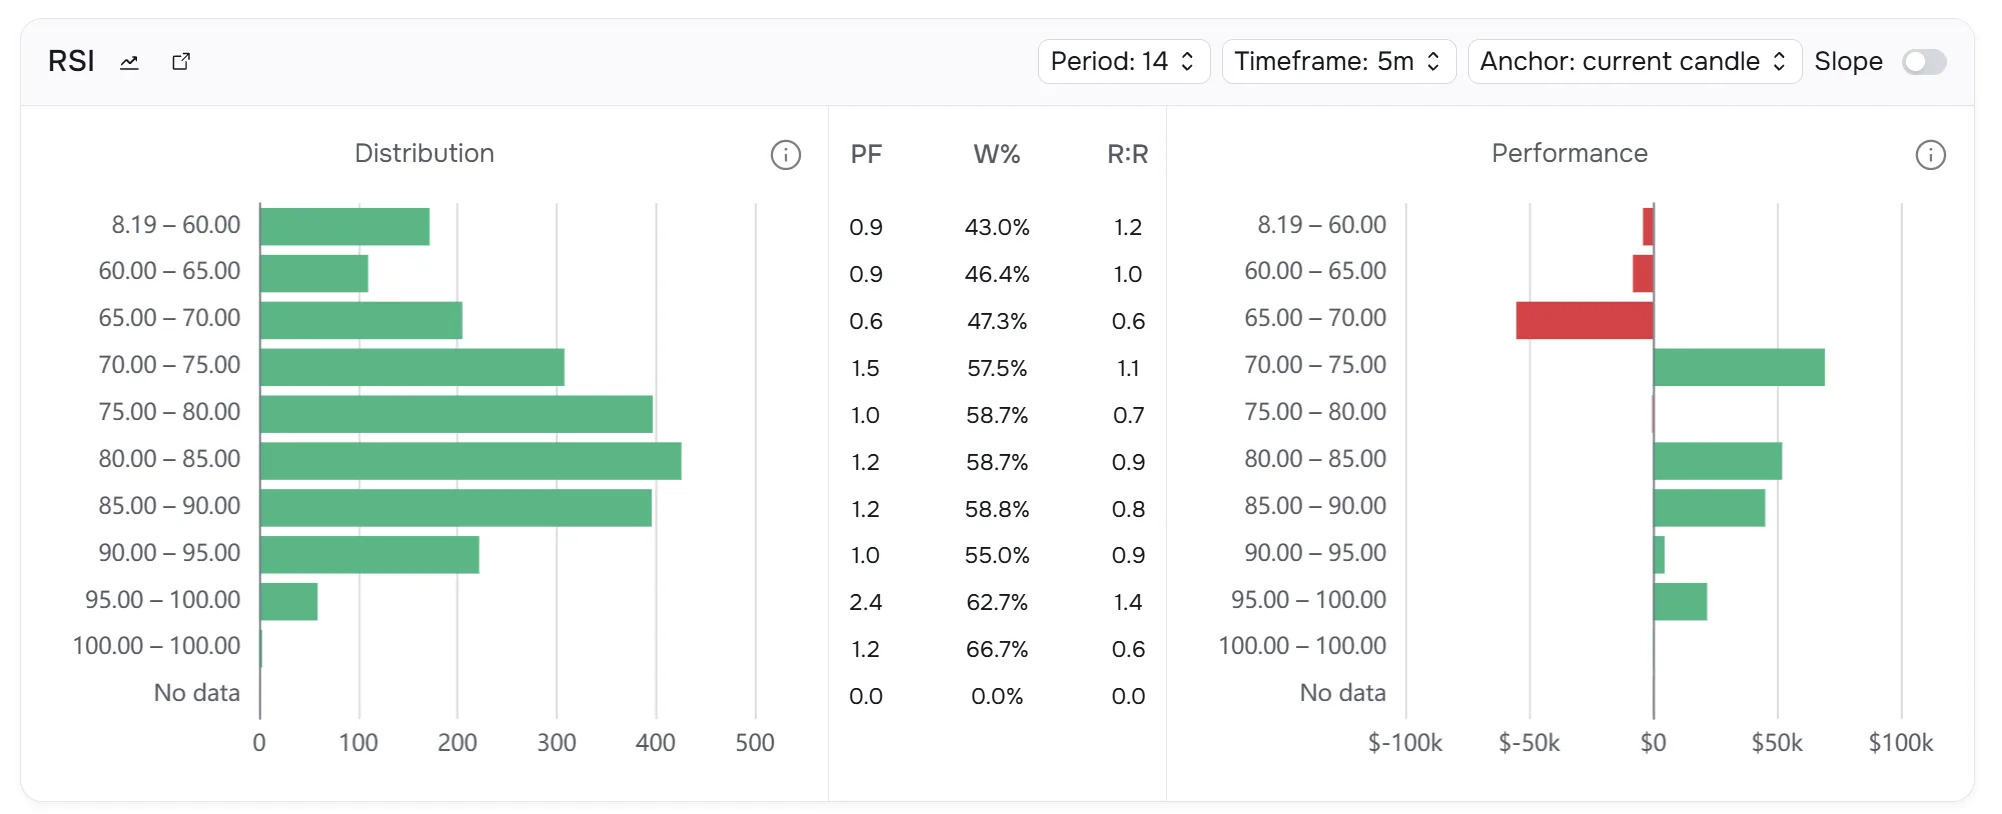
This RSI widget is not just displaying an indicator. It groups historical entries by RSI range using a defined setup — Period 14, 5-minute timeframe, Current Candle — and shows Distribution, Profit Factor, Win Rate, R:R, and P&L for every range.
Compare
Tradervue already compares groups. Datrade changes what those groups can be built from.
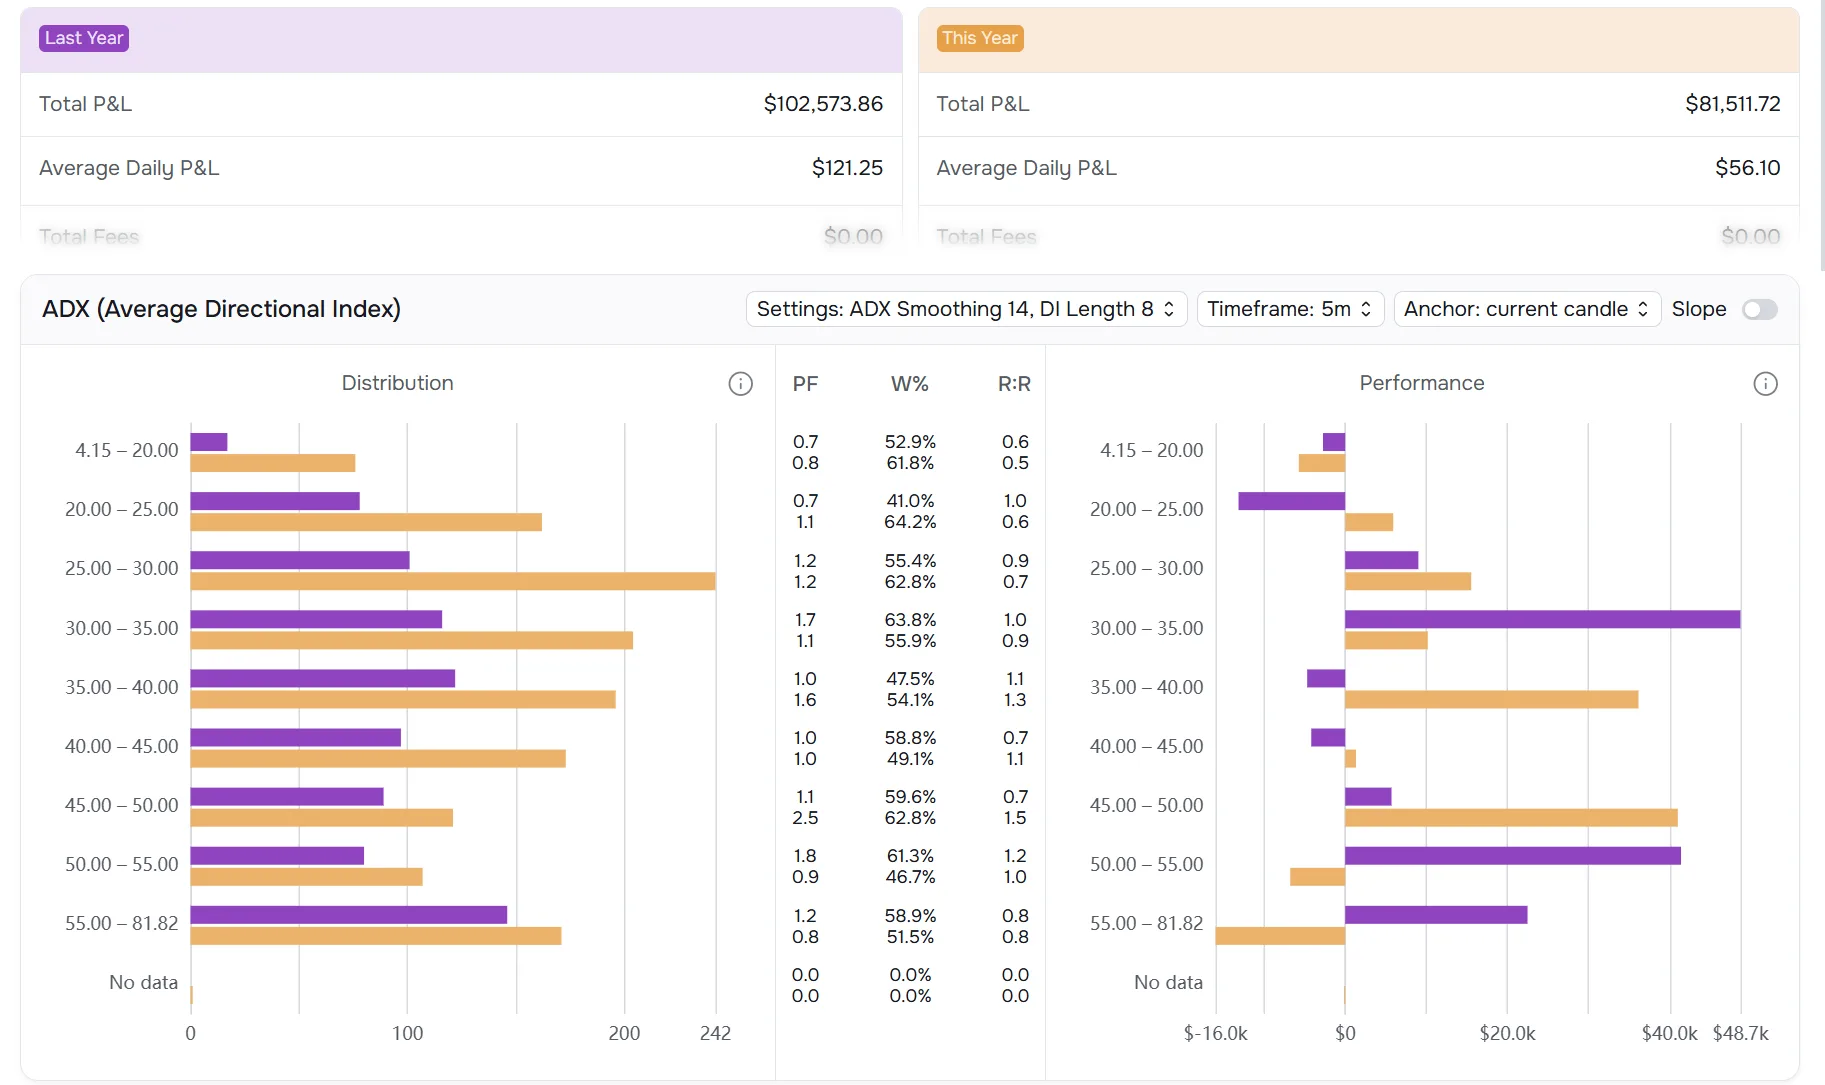
Tradervue Compare is a real, useful feature. Datrade's advantage is that Group A and Group B can be built from the deeper market-context layer as well as ordinary trade, account, tag, and performance fields.
The example here compares Last Year vs This Year on the same ADX settings, range by range.
Pivot
A profitable bucket doesn't necessarily mean you found an edge.
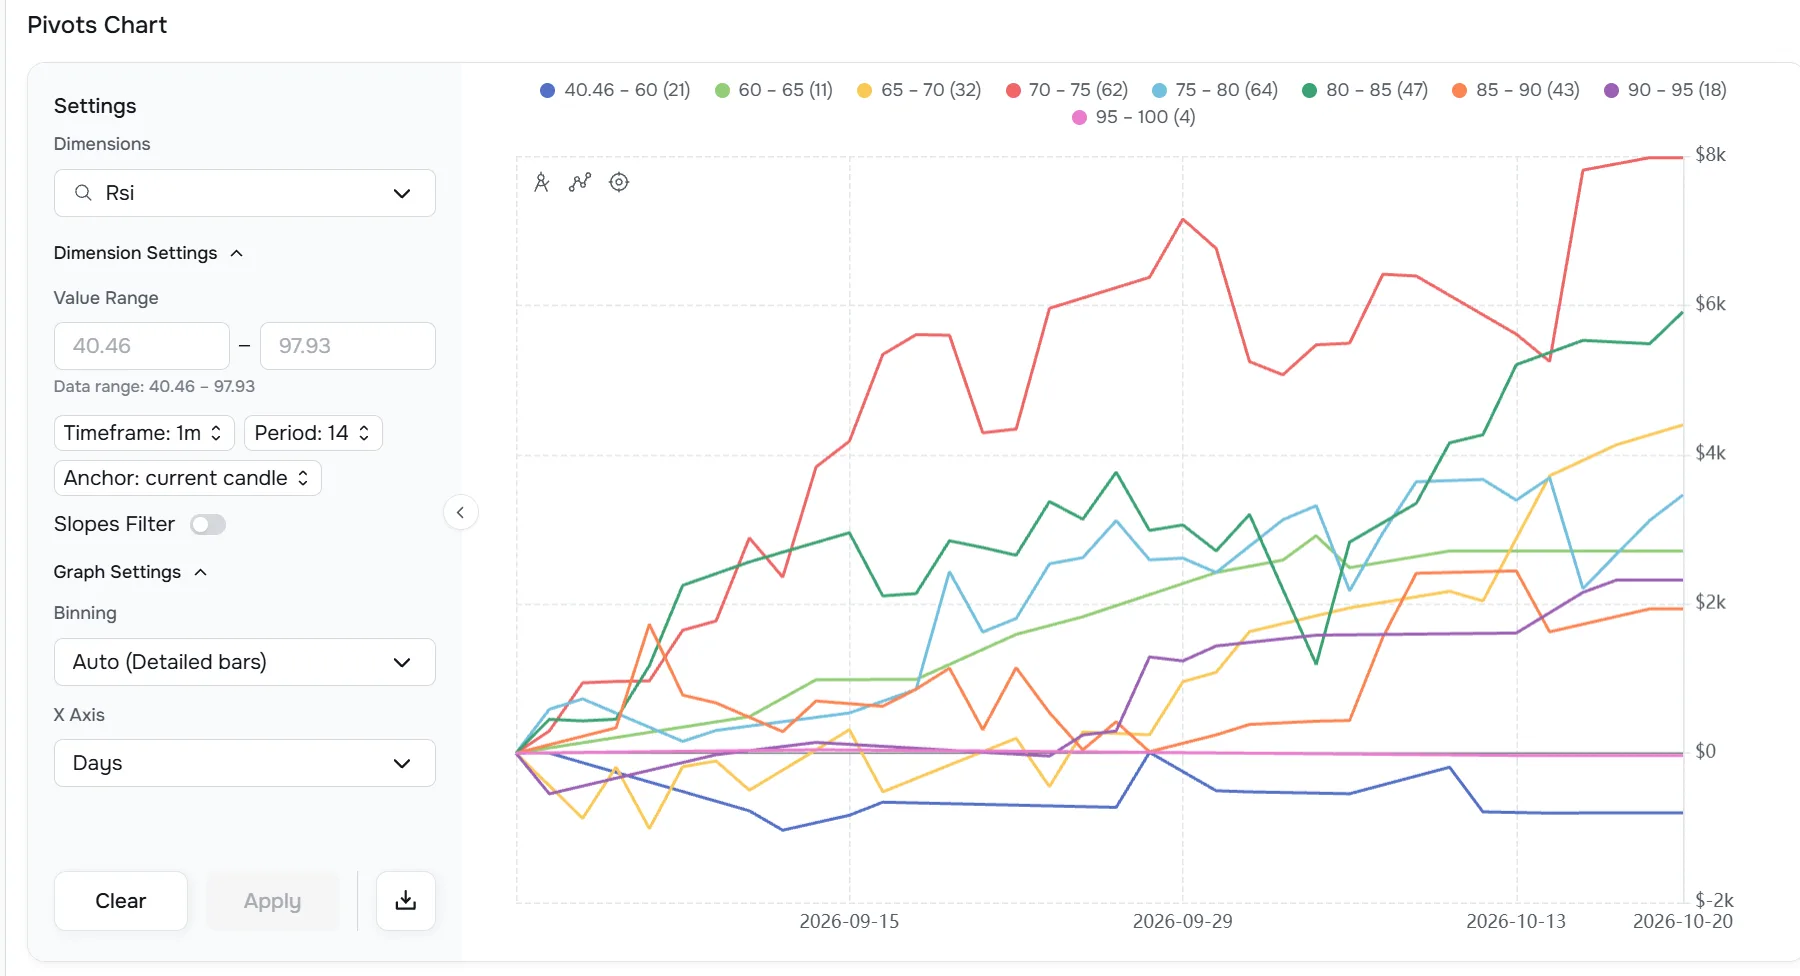
If RSI 70–80 made +$8,000, did that result build steadily or come from one outlier? Pivot shows cumulative performance curves for different ranges across Trades or Days so you can see whether an apparent edge persisted.
Scatter
Tradervue has X/Y trade plots. Datrade gives those axes different data.
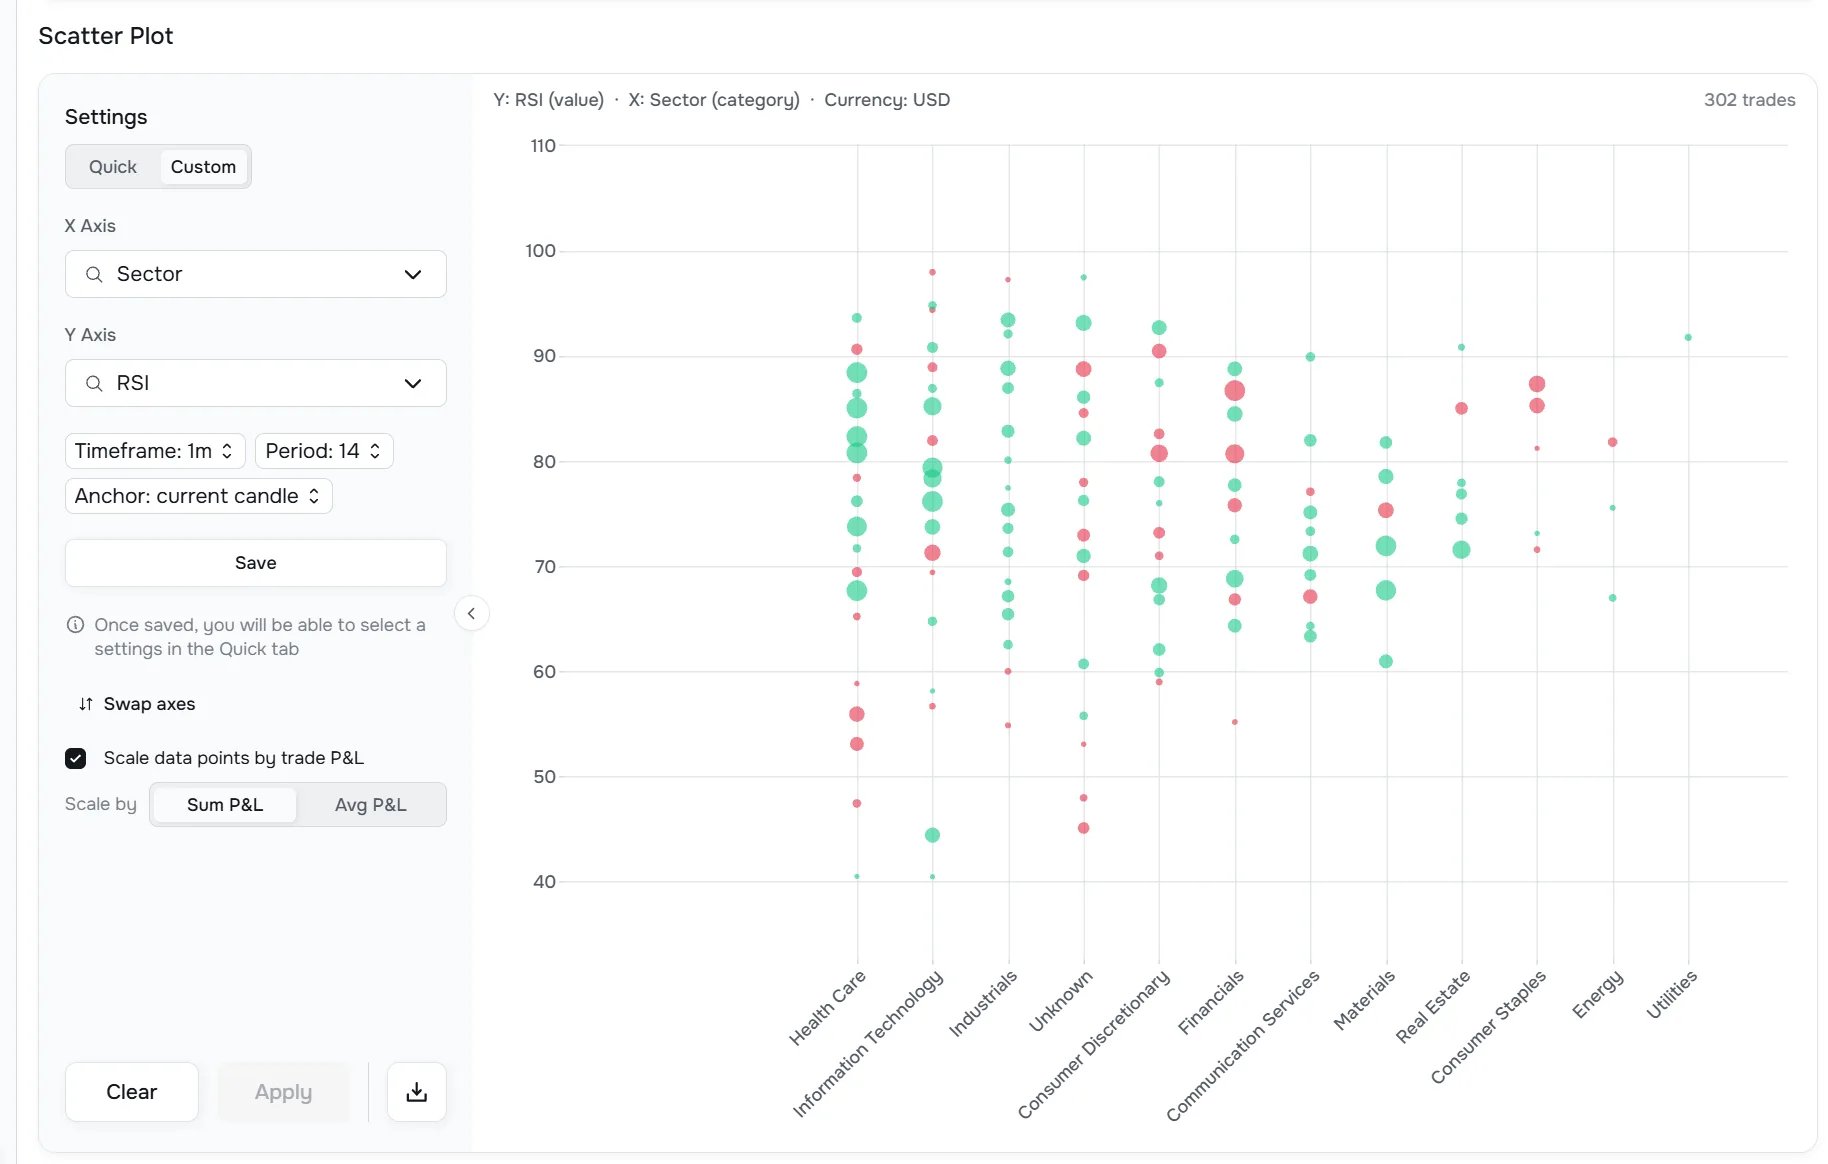
Put one supported market or trade variable on each axis and see where profitable and unprofitable trades cluster — using the same historical context calculated around your entries.
Where each journal is genuinely stronger.
The useful question is not which product has the longest feature list. It is which product is built around the job you care about most.
Datrade
Entry-time market context
Research the market state around the actual decision moment.
Current vs Previous Candle
Separate execution-time conditions from the completed signal candle.
10,000+ precomputed values per entry
This does not mean 10,000 different indicators — it includes supported combinations of indicators, timeframes, periods, candle anchors, session definitions, stock/event data and benchmark context.
Multi-factor research
Use Filters, Compare, Pivot, and Scatter across technical, volume, stock, event, and benchmark conditions.
Historical stock/event context
Market Cap, historical Shares Outstanding, SSR, halts, split-aware values, and more.
Tradervue
Full individual-trade chart review
Integrated TradingView charts with executions, studies, and multiple timeframes.
Mature classic reporting
100+ Advanced Reports, trend/risk reports, and rich report drill-downs.
Liquidity analysis
Dedicated adding/removing-liquidity reporting on Gold when broker data supports it.
Community and mentoring
Trade sharing, comments, privacy controls, and mentor/mentee workflows.
Options and Futures
Broader traditional asset coverage than Datrade currently offers.
Datrade vs Tradervue: the decision-relevant differences.
Tradervue is already a serious analytics journal. The table focuses on where the way the data is analyzed actually differs.
| Capability | Datrade | Tradervue |
|---|---|---|
| Main analytical focus | Full journal for analyzing the market conditions around real entries | Mature reporting, charts, and classic trade analytics |
| Point-in-time market state around entry | Core product architecture | Some Market/Instrument reports are day-level and use completed-day data |
| Current vs Previous Candle | Yes | No comparable journal-wide capability found in current public documentation |
| 10,000+ precomputed context values per entry | Yes | No comparable entry-level context matrix found in current public documentation |
| Journal-wide technical context by timeframe / period / session | Yes | Indicators available in TradingView charts; different research model |
| Broader-market technical context | SPY technical state in trade research | Multiple market proxies and day-level Market Behavior reports |
| Analyze market conditions you never tagged when the trade happened | Yes | Tags + predefined and expanding report fields |
| Advanced filtering | Yes | Yes |
| Compare two groups | Yes | Yes |
| X/Y trade analysis | Scatter using Datrade context dimensions | Advanced Reports using Tradervue report fields |
| Cumulative performance by context range | Pivot | No comparable cumulative performance curve by market-condition range found in current public documentation |
| Full individual trade chart | No | Yes |
| Dedicated liquidity analytics | No | Yes — Gold |
| Community / mentoring | No dedicated community | Yes |
| Trading accounts | Unlimited | Unlimited on paid plans |
| Markets | U.S. equities, Crypto, Forex | Equities, Options, Futures, Forex |
| Starting paid monthly price | $14 | $29.95 |
| Free access | 7-day full trial | Forever-free capped plan + paid-plan trial |
| Refund after payment | 7-day refund window | Paid sales final / non-refundable |
Monthly pricing.
Datrade has the lower paid starting price. Tradervue has a capped forever-free plan.
Datrade
Basic
1,000 raw executions/year · Unlimited accounts · Full underlying market-context coverage
Explore demo data or upload your own trades before paying.
Annual billing: up to 30% off · 7-day refund window after first payment
Tradervue
Paid plans
Free: current Help Center quota is 30 imported grouped trades per calendar month.
Silver/Gold include unlimited trade imports and accounts. Gold adds additional exit-analysis and liquidity features.
Paid plans can be tried for 7 days. Paid sales are final / non-refundable.
The bottom line
Both are serious trading journals. They separate when you ask why your trades worked.
Tradervue is strong at charting and reporting your trading history. Datrade adds the historical market context around each entry so you can research the conditions associated with your strongest and weakest results.
What did the market actually look like when I entered — and under which of those conditions do I perform best?
That is the job Datrade was built to do.
Frequently asked questions.
Does Datrade calculate market context automatically?
Yes. After you import or sync your trading history, Datrade automatically calculates the supported historical market context for each entry. You do not need to define those conditions before the trade happens.
Which is better for quantitative post-trade research: Datrade or Tradervue?
Datrade is the stronger fit when the main goal is researching objective market conditions around actual entries. Tradervue is especially strong for classic reports, individual-trade chart review, liquidity analysis, and sharing/mentoring workflows.
Is Datrade a full journal or just a market-data analytics tool?
Datrade is a full trading journal. It includes trade imports, Crypto Sync, manual entries, Notes, Tags, Calendar, unlimited accounts, commissions, R-multiple, MFE/MAE, performance and risk statistics, and exit analytics. Historical market-context research is the layer that differentiates it.
Does Tradervue have market analytics?
Yes. Tradervue has useful Market Behavior and Instrument reports, including market movement, opening gap, day type, volume, relative volume, ATR, entry vs SMA, and other fields. Several of those reports are day-level or calculated after the session. Datrade is differentiated by point-in-time entry context. Tradervue also has Compare and configurable X/Y Advanced Reports; Datrade differentiates itself through the market-context data those analyses can use.
Does Tradervue have RSI, MACD, and other indicators?
Yes. Tradervue's TradingView charts support custom indicators and studies. Datrade's difference is that supported historical indicator states become structured journal-wide variables that can be grouped, filtered, compared, and combined with other conditions.
Do some Tradervue market reports use end-of-day data?
Some specific Market and Instrument reports can. Tradervue documents Market Movement using the completed day's close and states that Instrument calculations rely on closing data. That makes those particular reports useful for classifying the completed day, but different from point-in-time entry analysis. This does not mean every Tradervue chart or field uses later information.
Does Datrade analyze scale-ins separately?
Yes. A later entry into the same position can carry different RSI, VWAP distance, RVOL and other supported market values than the first entry.
Which platform has better individual trade charts?
Tradervue. Its integrated TradingView charts provide execution markers, studies, and multiple timeframes. Datrade does not currently have a comparable full individual-trade chart.
Which platform supports Options and Futures?
Tradervue currently supports Options and Futures. Datrade currently supports U.S. equities, Crypto, and Forex, but not Options or Futures.