
Back
Dashboard Layout
Overview
Entering edit mode
Adding widgets
Small widgets (gauge / number)
Large widgets (charts & tables)
Reordering widgets
Saving and resetting
Back
Dashboard Layout
Overview
The Dashboard is a fully customizable widget grid. You choose which metrics to display, how many, and in what order. Changes persist across sessions.
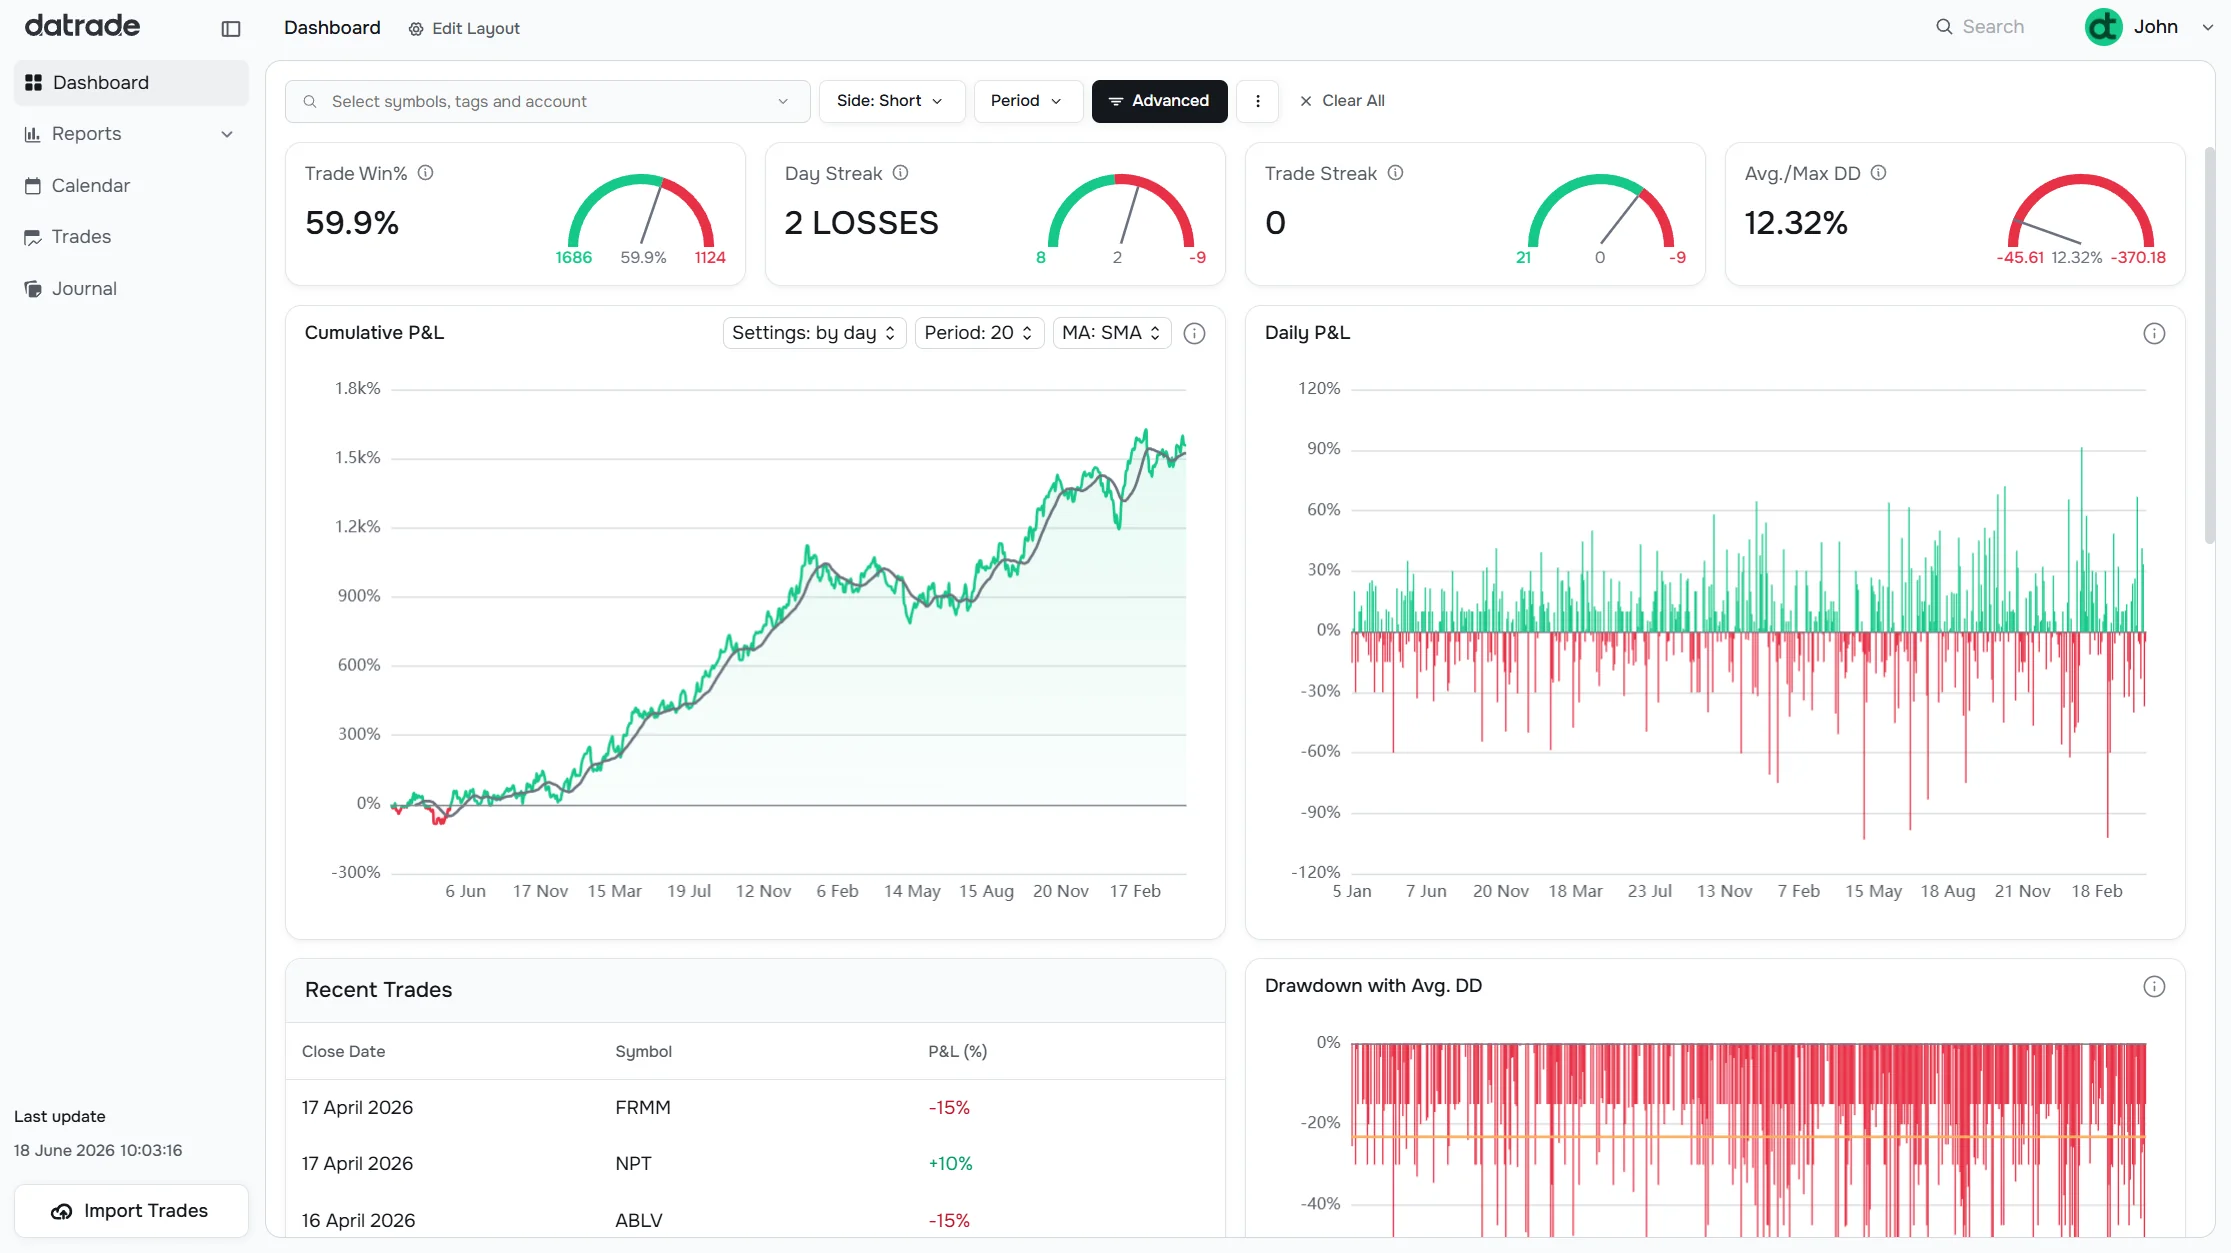
Entering edit mode
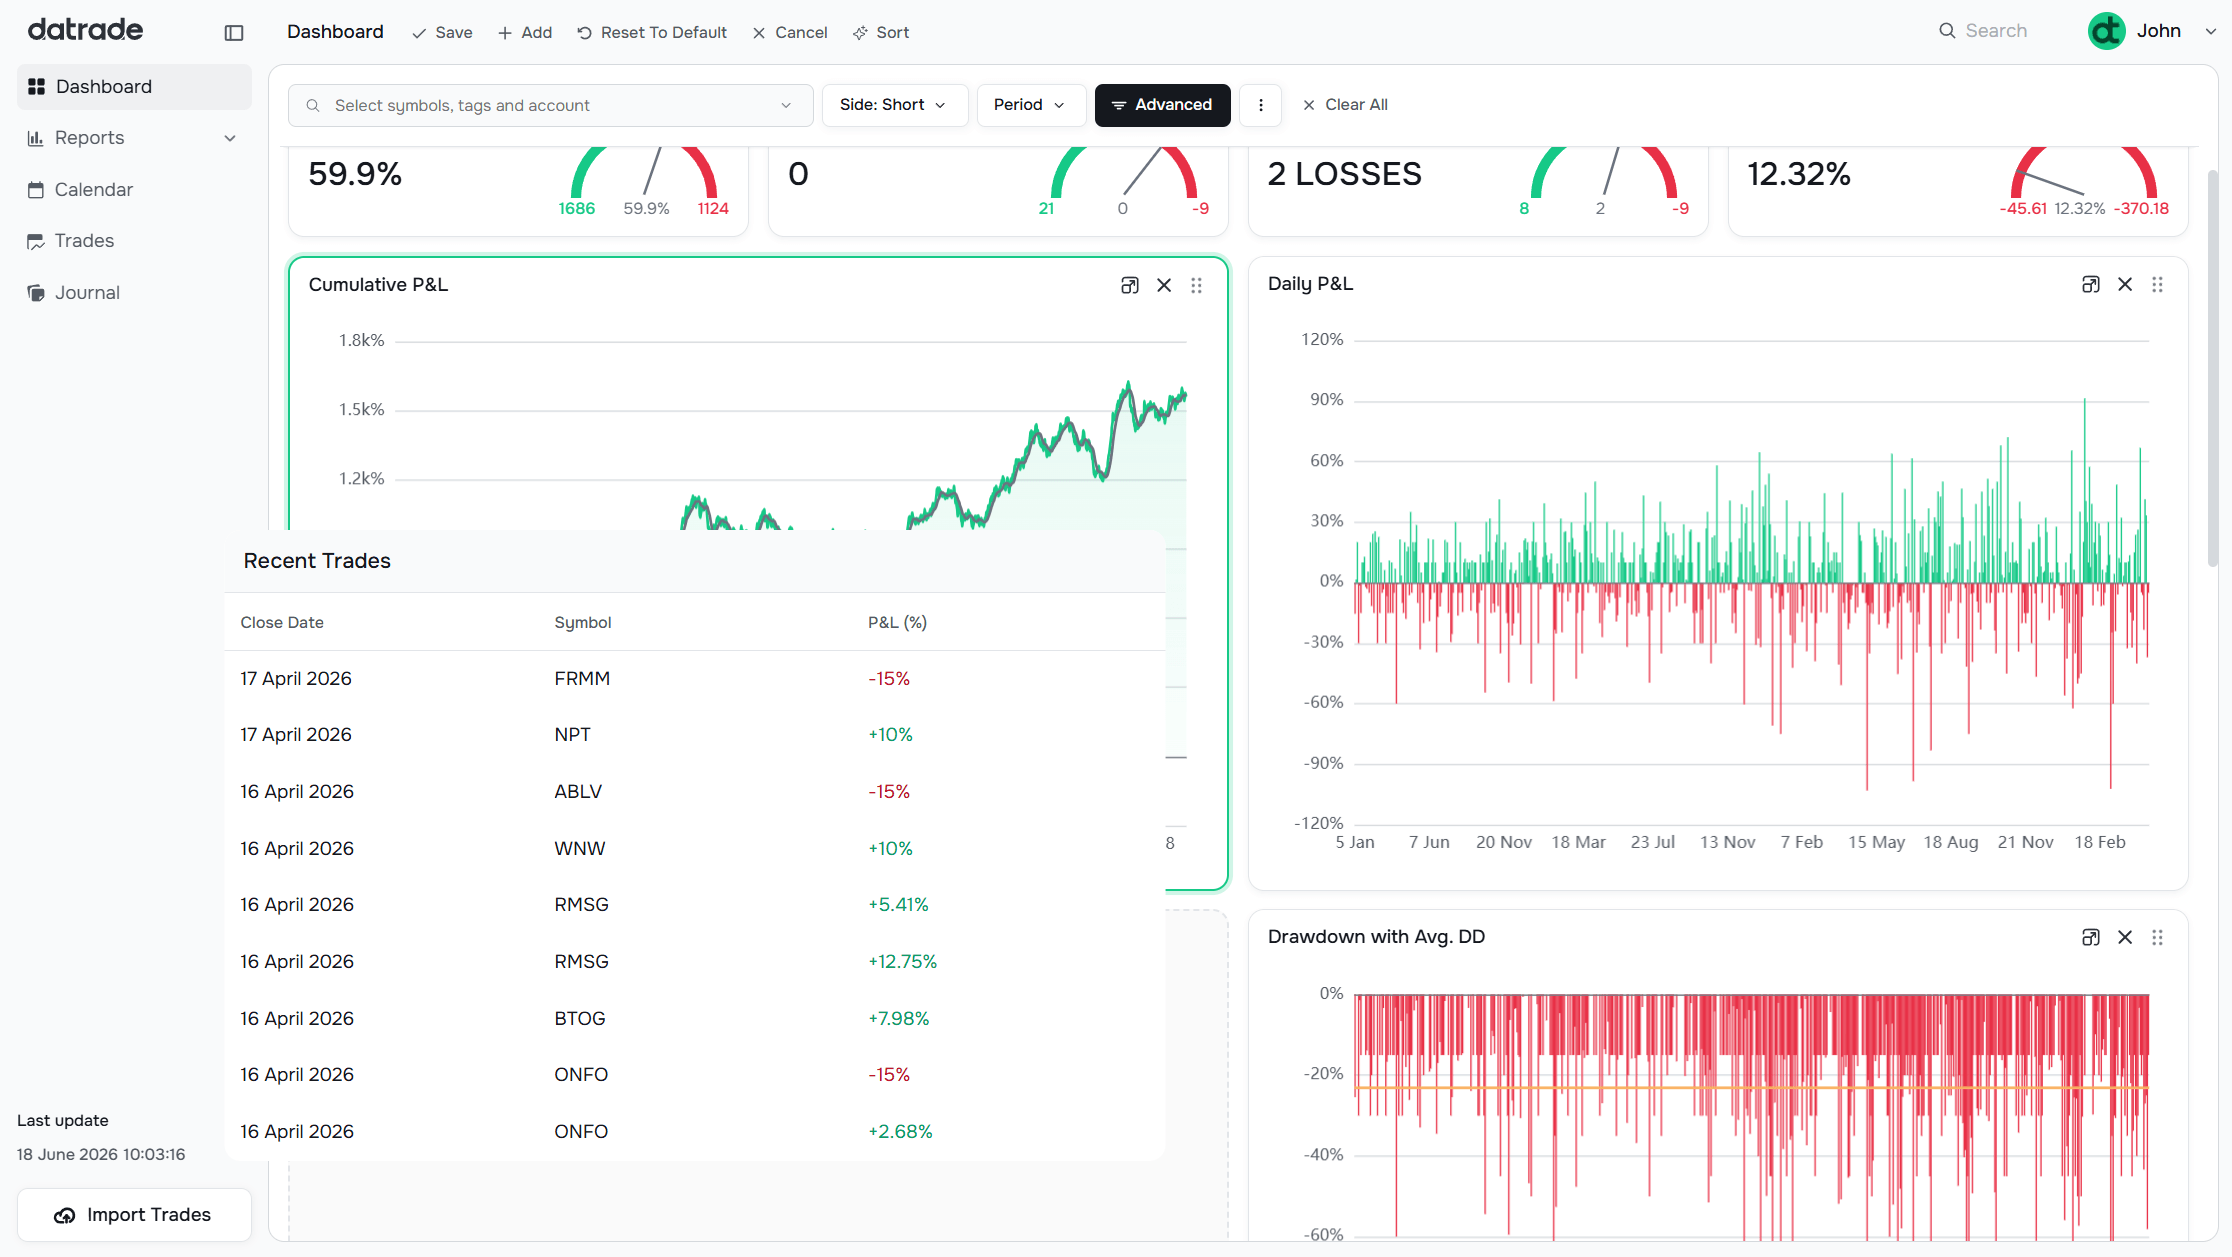
Click Edit Layout in the top-left header. The toolbar changes to show: Save, Add, Reset To Default, Cancel, and Sort.
Each widget on the grid gets two controls in its top-right corner:
- × — remove the widget from the dashboard
- ⠿ — drag handle to reorder
Adding widgets
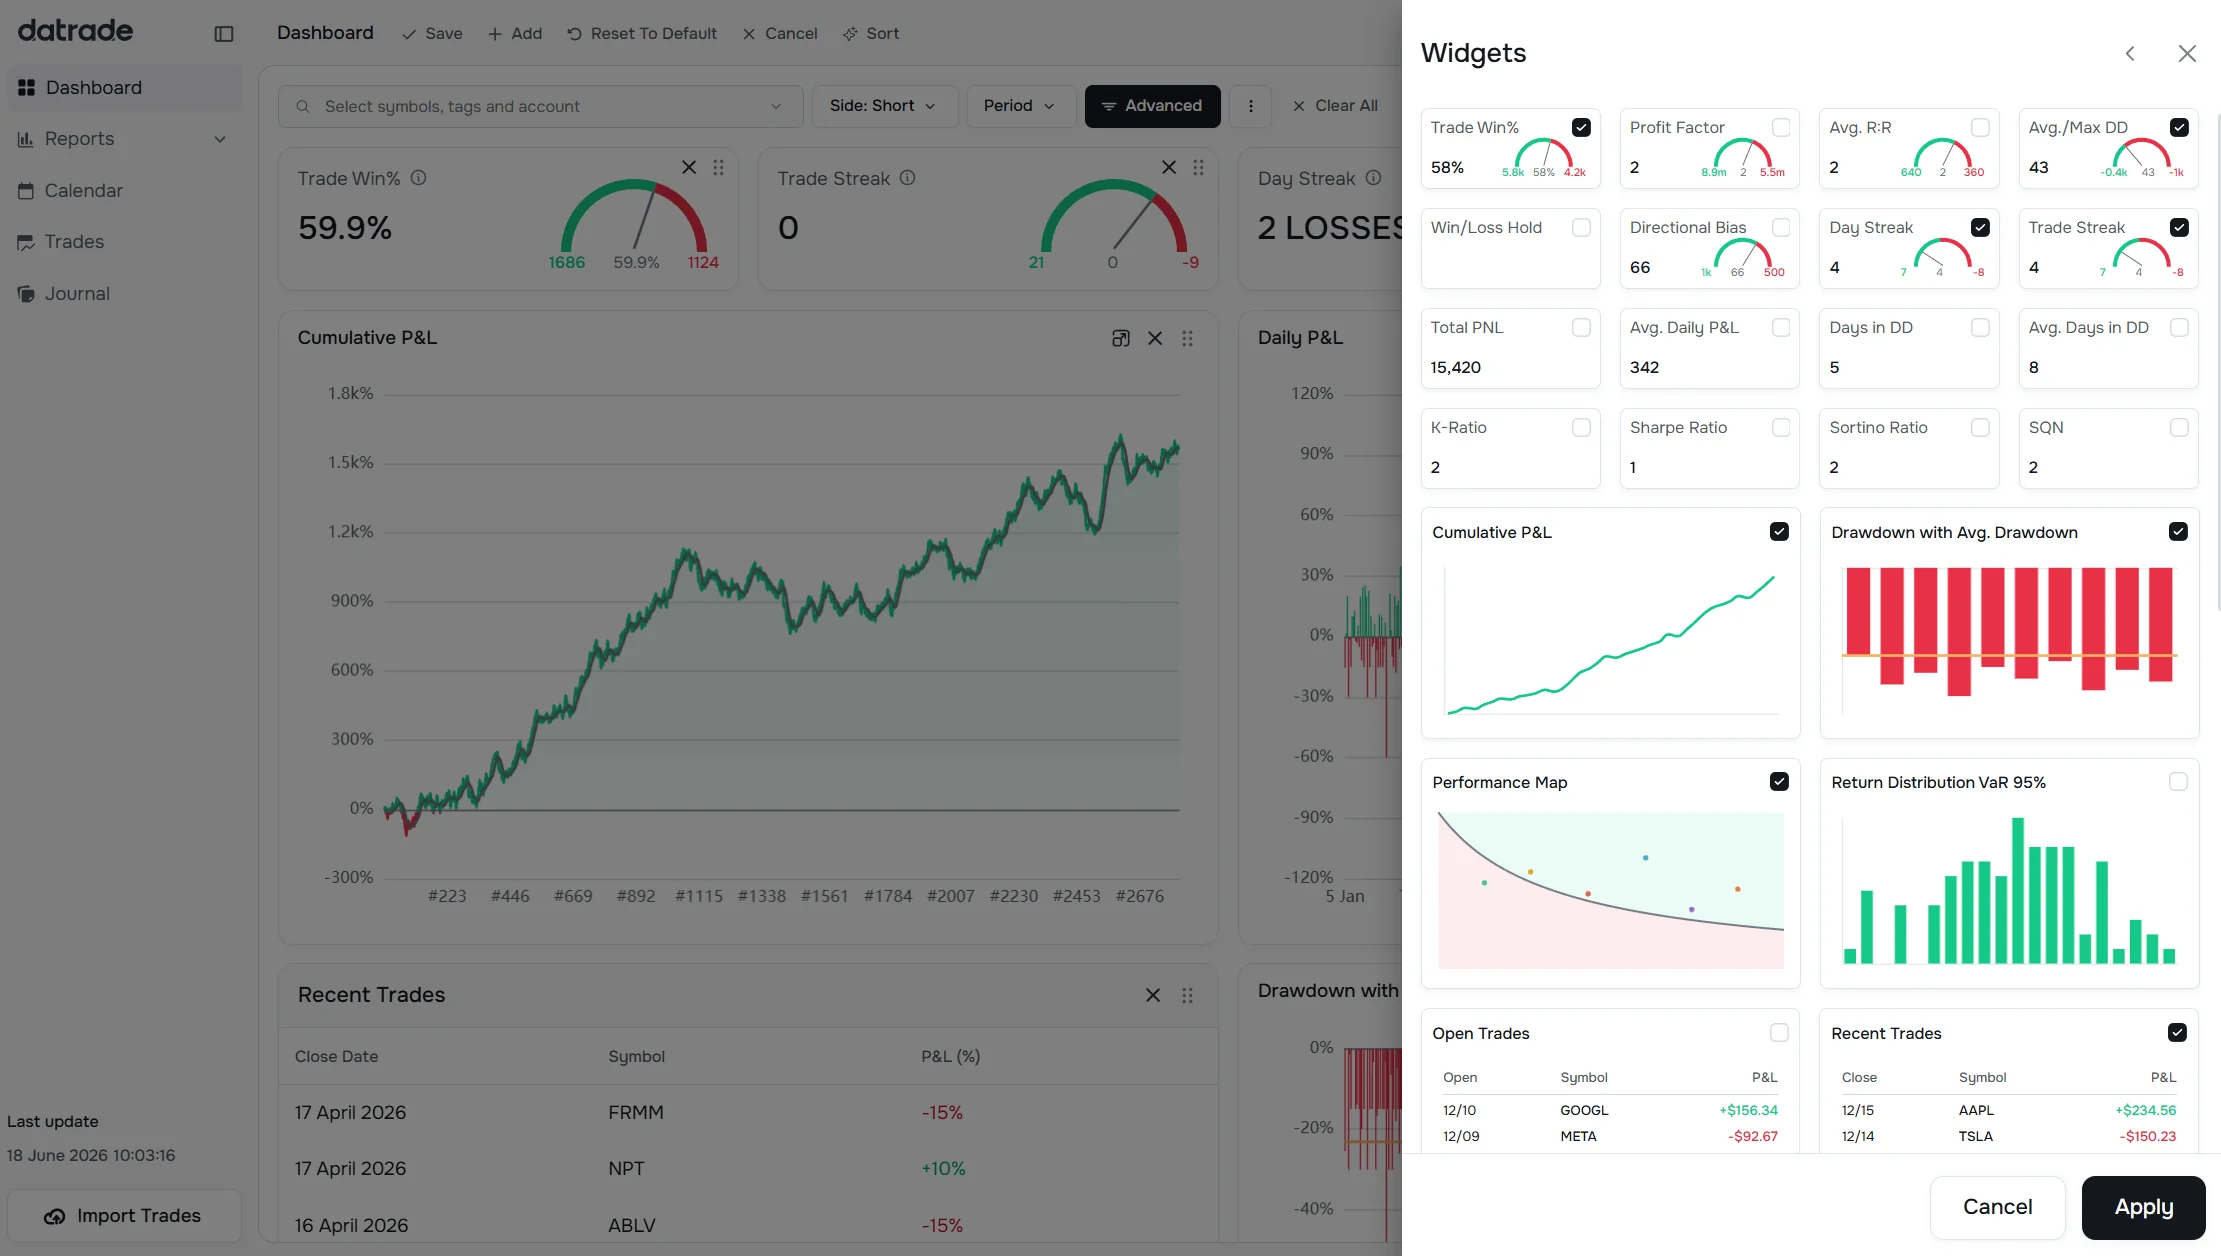
Click Add to open the widget picker. All available widgets are shown with preview thumbnails and checkboxes. Check the ones you want and click Apply.
Small widgets (gauge / number)
These appear as compact cards — two per row on a standard screen:
| Widget | What it shows |
|---|---|
| Trade Win% | Percentage of winning trades out of all closed trades |
| Profit Factor | Gross profit divided by gross loss |
| Avg. R:R | Average reward-to-risk ratio across all trades |
| Avg./Max DD | Average and maximum drawdown from equity peak |
| Win/Loss Hold | Ratio of avg. hold time in winners vs. losers |
| Directional Bias | Distribution of long vs. short trades |
| Day Streak | Current consecutive winning/losing day streak vs. your all-time max |
| Trade Streak | Current consecutive winning/losing trade streak vs. your all-time max |
| Total PNL | Total realized P&L across all closed trades |
| Avg. Daily P&L | Total P&L divided by number of trading days |
| Days in DD | Total days spent in drawdown |
| Avg. Days in DD | Average days to recover from a drawdown |
| K-Ratio | Equity curve consistency — higher = smoother growth |
| Sharpe Ratio | Risk-adjusted return per unit of total volatility |
| Sortino Ratio | Like Sharpe but only penalizes downside volatility |
| SQN | System Quality Number — evaluates system quality based on expectancy |
Large widgets (charts & tables)
These take up more space and show chart or table data:
| Widget | What it shows |
|---|---|
| Cumulative P&L | Running total P&L as a line chart |
| Drawdown with Avg. Drawdown | Daily drawdown bars with average drawdown line |
| Performance Map | Win Rate vs. R:R scatter. Colored dots per time period; breakeven curve shows the minimum win rate needed for your average R:R to be profitable. Two dashed Tier curves (Tier 1.5 and Tier 2.5) split the profitable area into Positive, Strong and Exceptional zones. |
| Return Distribution VaR 95% | Histogram of daily returns with 95% VaR threshold |
| Open Trades | Table of currently open positions |
| Recent Trades | Table of recently closed trades |
| Win % – Avg. Win | Dual line: win rate and average win over time |
| Daily P&L | Bar chart of daily P&L |
| Weekly P&L | Bar chart of weekly P&L |
| Performance By Symbol | Best and worst performing instruments |
| Day Streaks | History of win/loss day streak lengths |
| Trade Streaks | History of win/loss trade streak lengths |
| Win Curve | Cumulative win progression over all trades |
| Calendar | Monthly calendar view with daily P&L coloring |
For metric definitions (K-Ratio, Sharpe, Sortino, SQN, etc.) see the Metrics Glossary.
Reordering widgets
In Edit Layout mode, grab any widget by its drag handle and drop it into a new position.
Alternatively, click Sort in the toolbar to auto-sort all widgets alphabetically.
Saving and resetting
- Save — saves the current layout
- Cancel — discards unsaved changes
- Reset To Default — restores the original default set of widgets and their positions
Have a question?
Let us help!
To get the best response, follow these steps when submitting your request:
Be Clear
Briefly describe the issue and any key details, like the feature used or an error message
Add Context
Explain what you were trying to do and what led to the issue
Attach a Screenshot (Optional)
A visual reference can speed up troubleshooting
We'll review your request and get back to you soon!
Get latest updates
on Datrade
Disclaimer: Datrade is not an investment advisor or signal provider. All market data and analytics are provided for informational purposes only and do not constitute financial advice or trading recommendations. Past performance is not indicative of future results, and no performance outcomes are guaranteed. Users are solely responsible for their trading decisions and actions; Datrade accepts no liability for any losses incurred from use of our data or content. Use of this site constitutes acceptance of our Terms of Service and Risk Disclosure.